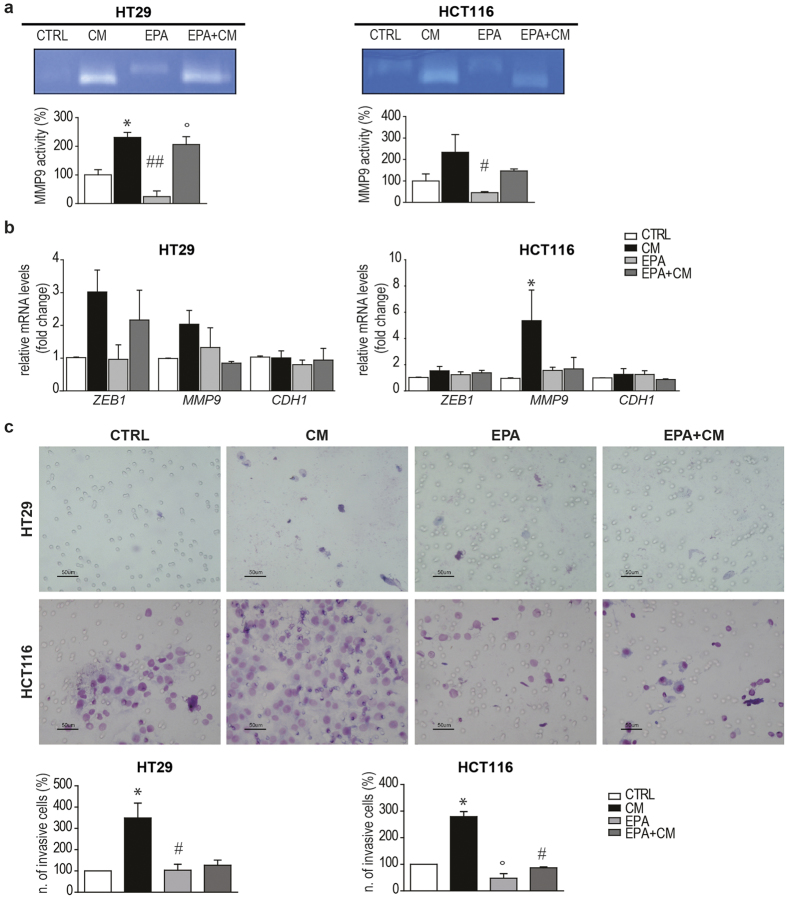
Figure 6. Effect of EPA-FFA on CM-induced MMP9 activation and invasion.
(a) Gelatin zymography in response to EPA-FFA (72 h) and/or CM (12 h) treatment in HT29 (left panel) and HCT116 (right panel). Bars indicate Mean ± SEM of densitometric values of MMP9 active form normalized to the corresponding CTRL values (ANOVA p = 0.0067 for HT29 and p = 0.0473 for HCT116, (N = 2). (b) qRT-PCR for ZEB1 (ANOVA p = n.s for HT29 and HCT116), MMP9 (ANOVA p = n.s for HT29 and p = 0.0525 for HCT116) and CDH1 (ANOVA, p = n.s for HT29 and HCT116) in HT29 and HCT116 EPA-FFA and/or CM treated cells (n = 2; N = 3). (c) Matrigel invasion assay of HT29 (upper panel) and HCT116 (lower panel) treated with EPA-FFA (72 h) and/or CM (12 h). Bars indicate Mean ± SEM of number of invasive cells/chamber normalized to the corresponding CTRL values (ANOVA p = 0.0284 for HT29 and p = 0.0007 for HCT116), (n = 5, N = 2). Analyses were performed on logarithmic transformed data. After the ANOVA global test, Tukey’s post hoc test was used for multiple pairwise comparisons. *p < 0.05, **p < 0.01, ***p < 0.001 compared to CTRL; #p < 0.05, ##p < 0.01, ###p < 0.001 compared to CM; °p < 0.05, °°p < 0.01, °°°p < 0.001 compared to EPA-FFA.

