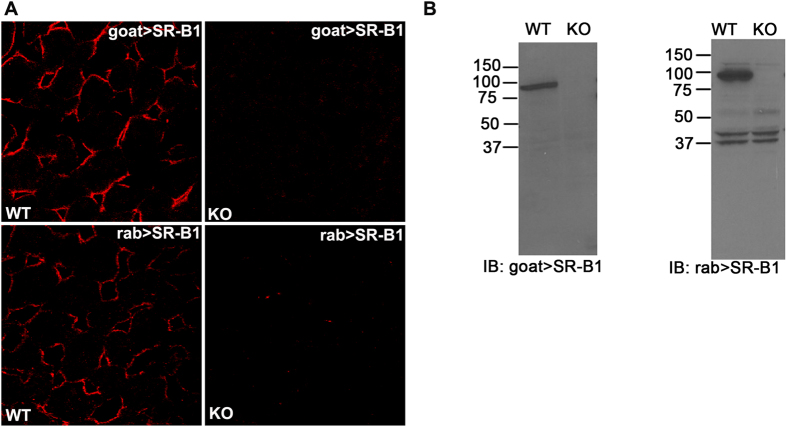
Figure 2. Validation of SR-B1 antibodies.
(A) Confocal microscopic image of WT (left panels) and SR-B1 KO (right panels) liver sections labeled with goat IgG anti-SR-B1 (top row) and rabbit IgG anti-SR-B1(bottom row). (B) ECL immunoblots developed using goat (left) and rabbit (right) anti-SR-B1 showing the presence and absence of the SR-B1 band (molecular weight ~ 82 kDa) in WT and KO liver lysates, respectively. Numbers are MW markers in kDa. Note the presence of low MW non-specific bands of equal intensity in WT and KO, supporting equal protein loading (10 μg) in both lanes. Gel images are not cropped except for the irrelevant lateral lanes.

