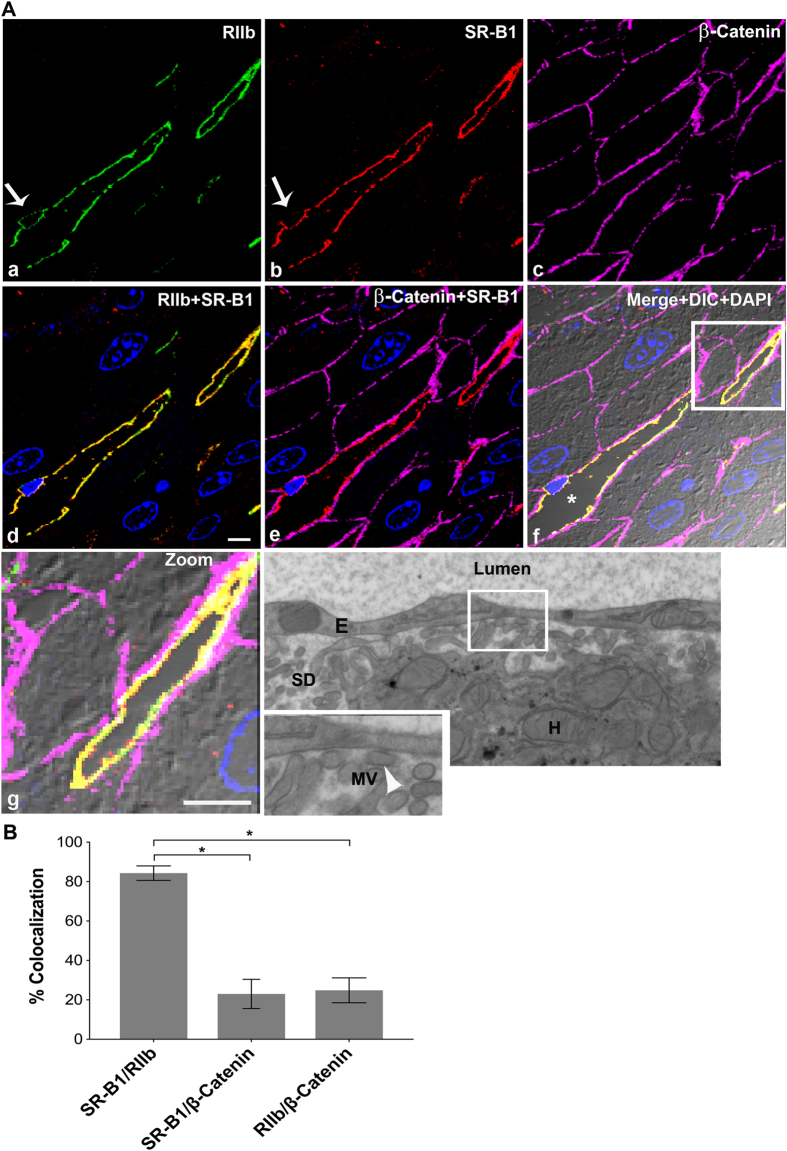
Figure 3. High resolution confocal image illustrates that SR-B1 is predominantly expressed in LSEC.
(A) High-resolution 4-color immunofluorescence images of an ultrathin (120 nm) cryosection from BALB/c liver localizing mab 2.4G2 anti-RIIb (green) in panel a, goat IgG anti-SR-B1 (red) in panel b, mouse IgG anti-β-Catenin (magenta) in panel c, a merge of panels a and b in panel d, and a merge of panels b and c in panel e. Panel f shows merges of the 4 color images plus DIC and DAPI staining. Panel g shows the zoomed area outlined in panel f. Panel h shows a high magnification transmission electron micrograph of mouse liver showing the lumen of the sinusoid lined by LSEC. The Space of Disse (SD), containing numerous microvilli (MV) (arrow head) projecting from the membrane of hepatocytes (H), touching the LSEC membrane is shown in the zoomed panel of g. Arrow in panels a and b points to the nucleus of an LSEC circumferentially lined by both RIIb and SR-B1. In panel f, * identifies the sinusoidal lumen. The scale bar in panel d (a–g) equals 5 μm. (B) The bar graph plots the percentage of signal from anti-SR-B1 (red) colocalizing with signal from anti-RIIb (green) or anti-β-catenin (magenta) and also colocalization of both LSEC (green) and hepatocyte marker β-catenin (magenta). Using the student’s t-test, the data of bars 1 and 2 and also bars 2 and 3 were compared. *p < 0.0001.

