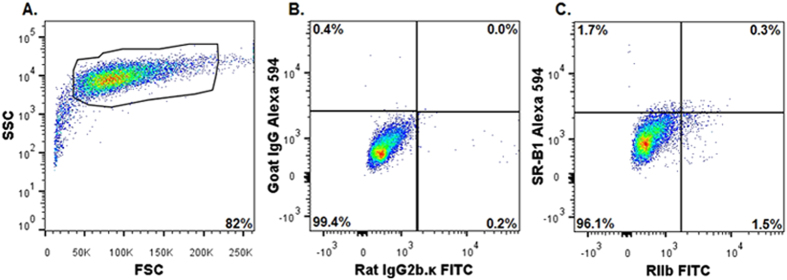
Figure 6. Three color flow cytometric analysis of PC of liver show negligible expression of SR-B1, ex vivo.
(A) A representative flow cytometric acquisition plot showing forward scatter (FSC) vs side scatter (SSC) of a PC preparation, with the gate (PC) indicated. Note the log Y axis scale for SSC, indicating large cells. (B) Two-color flow cytometric analysis of gated PC for isotype controls FITC-rat IgG2b.κ and Alexa 594 goat IgG. (C) A two-color analysis of gated PC using FITC-mab 2.4G2 IgG anti-RIIb and Alexa 594 goat IgG anti-SR-B1. Two color flow cytometric analysis of gated PC for isotype controls Alexa 594 goat IgG and Alexa 647 mouse IgG1. (E) Two-color flow cytometric analysis of gated PC for Alexa 647 anti β-Catenin and Alexa 594 goat IgG anti-SR-B1. In (A–E), events are represented as blue points, with areas of very high density and high density colored red and yellow, respectively. As in Fig. 5, the percentage of events showing single or double positive expression is indicated in respective quadrants. The results are representative of 3 different experiments.

