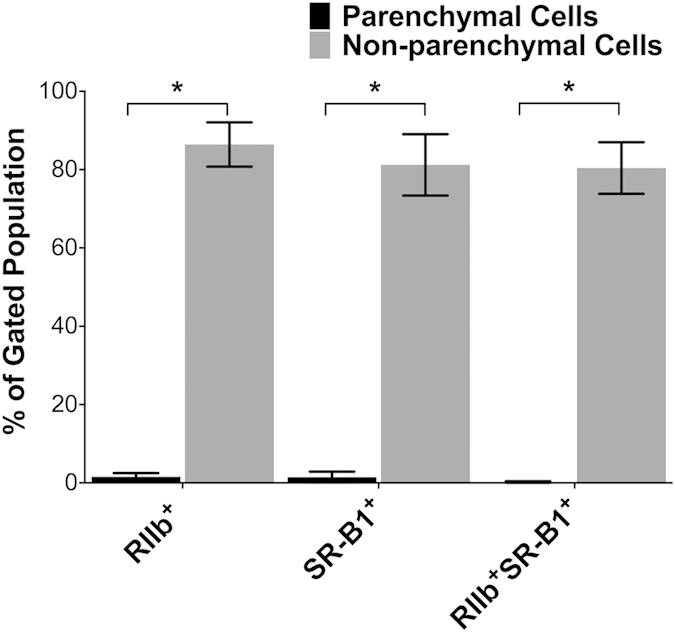
Figure 7. In liver, SR-B1 is expressed mostly in NPC rather than PC.

Shown is a bar graph comparison of SR-B1-expression by PC and NPC: The multi-color flow-cytometry experiments described and displayed as in Fig. 5 and 6 were each repeated 4 times. The events indicated in the upper right quadrant of the 4 experiments were averaged for each cell-type and expressed in the bar-graph as mean ± SD after correcting for (subtracting) the intensity of isotype-control antibodies. *p < 0.0001.
