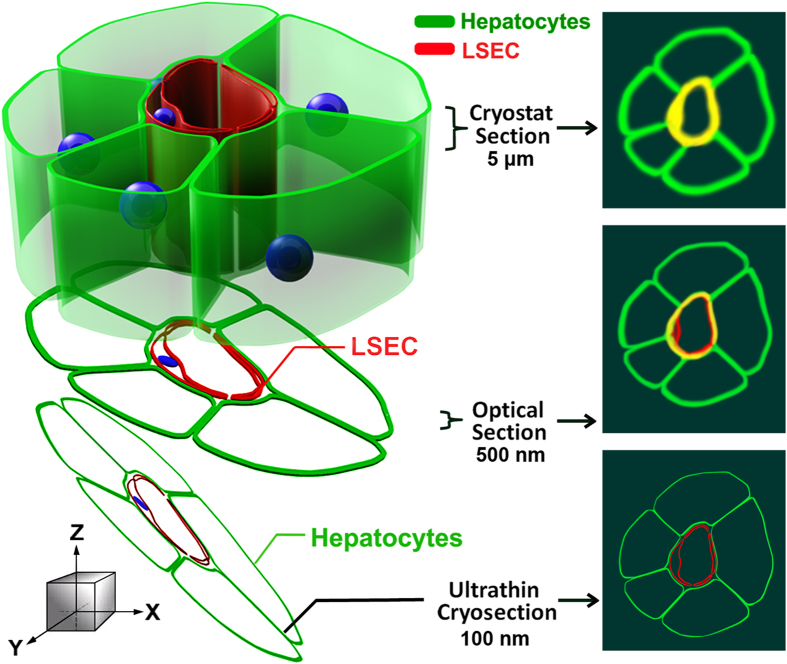
Figure 9. Model illustrating the advantages of using ultrathin cryosections for high-resolution IF microscopy.
The figure illustrates plasma membrane structures of LSEC and hepatocytes labeled with fluor-tagged mab 2.4G2 (red) and anti-β-catenin antibody (green). (Left) Schematic model of immunostained liver sinusoid cut into sections of different thicknesses (cryostat section, optical section, and ultrathin cryosection). (Right) Fluorescence signals in the x- and y-dimensions (top view in the z direction). In a top view of conventional cryostat sections (>5 μm thick), 2.4G2 and β-catenin fluorescence signals are indistinguishable, thus presenting false co-localization (yellow). In a confocal view of optical sections (~500 nm thick), the potential for false co-localization is reduced due to less signal diffusion compared to thicker cryostat sections. However, a detailed relationship of LSEC and hepatocytes is still difficult to resolve due to blurring of 2.4G2 and β-catenin fluorescence signals. In a confocal view of ultrathin cryosections (50–150 nm thick), the signal diffusion of fluorescence signals is minimized and the two cells are distinct.

