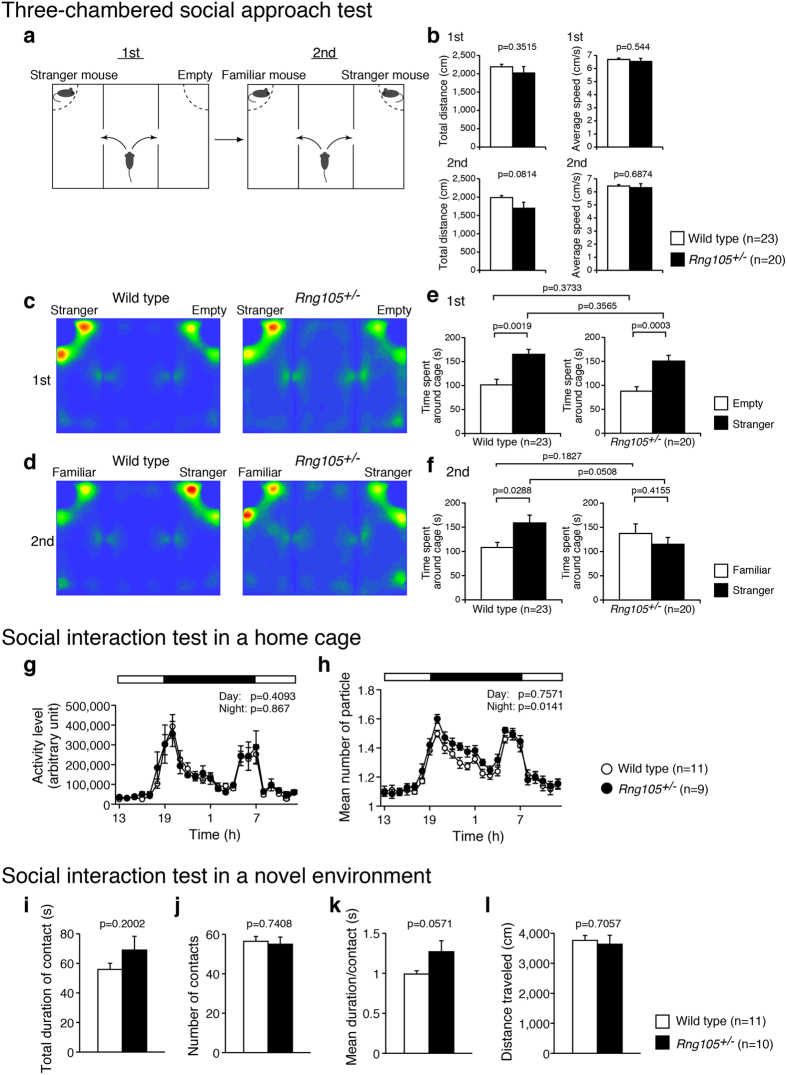
Figure 2. Social interaction abnormalities in Rng105+/− mice.
(a–f) Three-chambered social approach test. (a) Schematic diagram of the test. In the first session, one of the cages contains a stranger mouse. In the second session, the stranger mouse becomes familiar to the test mouse, and the other stranger mouse is put in the other cage. (b) Total distance traveled and the average locomotor speed in the first and the second sessions. (c,d) Heat maps showing the average traces of 23 wild-type mice (left panels) and 20 Rng105+/− mice (right panels) in the first session (c) and the second session (d). (e,f) Time spent around either the empty cage or the stranger mouse cage in the first session (e) and either the familiar or stranger mouse cage in the second session (f). (g,h) Social interaction test in a home cage. White and black bars indicate lights on and off, respectively. The data are represented as the average of five days (day 3 to day 7) from a 7-day experiment. (g) Locomotor activity in the home cage test. (h) Social interaction of two mice as judged by the number of the particle. When the mice are apart from each other, the particle number is two, and the particle number is one when they are close to each other. Therefore, larger number of particle indicates less interactions. n = 11 and 9 pairs for wild-type and Rng105+/− mice, respectively. (i–l) Social interaction test in a novel environment. Pairs of the same genotype mice were tested. (i) Total duration of contact with each other. (j) The number of contacts. (k) Mean duration per contact. (l) Total distance traveled. n = 11 and 10 pairs for wild-type and Rng105+/− mice, respectively. Data are presented as mean ± S.E.M. P-values from one-way ANOVA (b, between different genotypes in e and f, and i-l), paired t-test (between the same genotypes in e,f) and two-way repeated measures ANOVA (g,h) are indicated.

