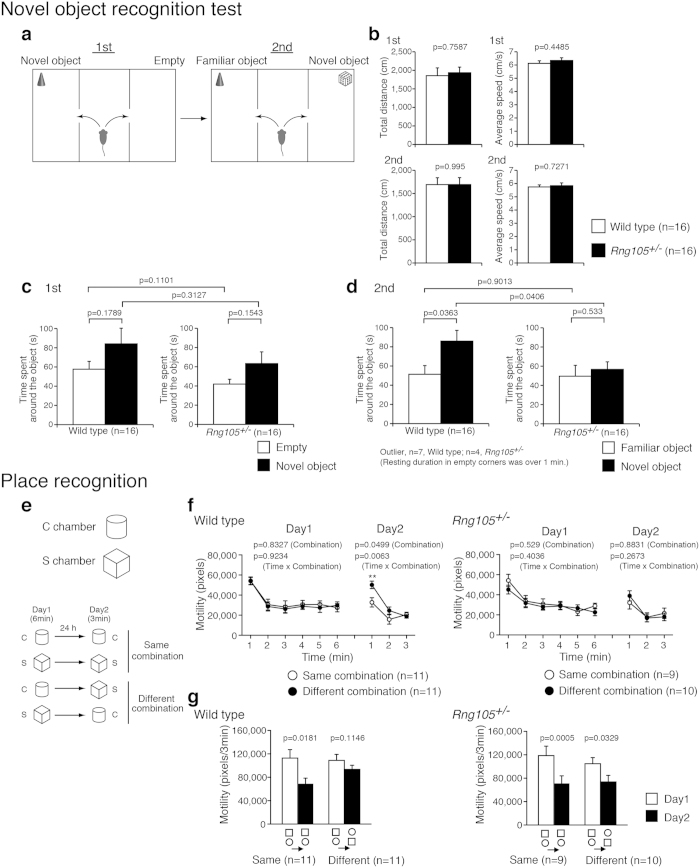
Figure 3. Response to novel objects and novel place patterns was reduced in Rng105+/− mice.
(a–d) Novel object recognition test. (a) Schematic diagram of the test. In the first session, an object is put in a corner of a chamber. In the second session, the object becomes familiar to the test mouse, and a different type of object is put in a corner of the other chamber. (b) Total distance traveled and the average locomotor speed in the first and the second sessions. (c,d) Time spent around either the empty corner or the novel object in the first session (c) and either the familiar or novel object in the second session (d). (e–g) Place recognition test. (e) Schematic diagram of the test. Mice were put into the C chamber (circle) or the S chamber (square) for 6 min on day 1. On day 2, they were put into the same chamber (same combination) or the other chamber (different combination) for 3 min. (f) Motility of wild-type mice (left panel) and Rng105+/− mice (right panel) put into the same or different combination of the chambers on day 1 and day 2. (g) The sum of the motility in the first 3 minutes on day 1 (white bars) and 3 minutes on day 2 (black bars) for each group of mice. Data are presented as mean ± S.E.M. P-values from one-way ANOVA (b, between different genotypes in c and d), paired t-test (between the same genotypes in c and d, and g), and p-values for the main effect of the chamber combination and the interaction effect (time × chamber combination) in two-way repeated measures ANOVA (f) are indicated. **p < 0.01, one-way ANOVA at the same time point.

