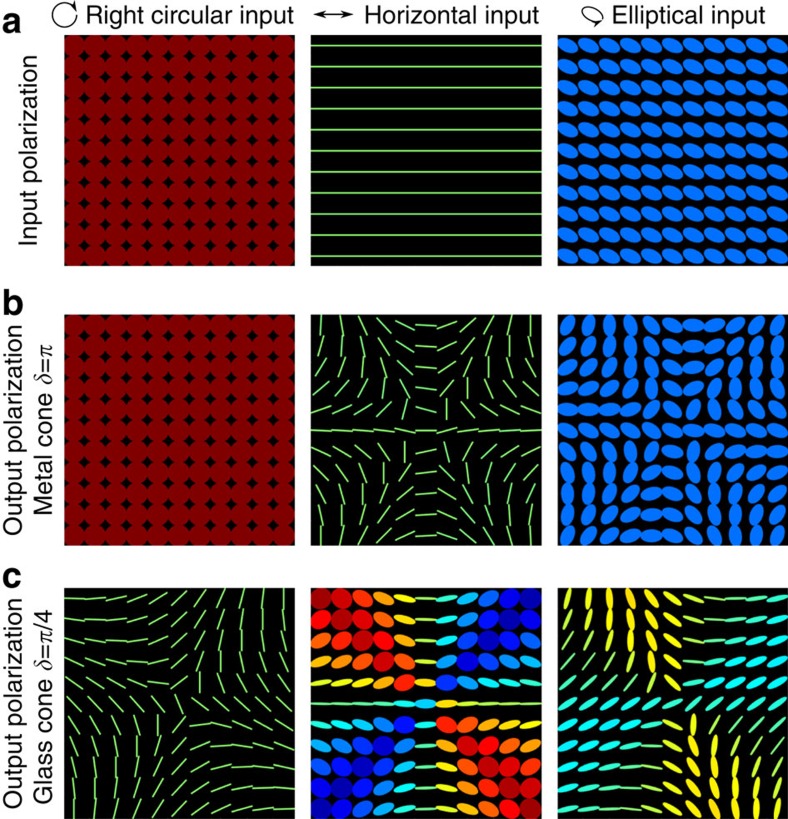
Figure 2. Theoretical polarization patterns.
Theoretical prediction of polarization patterns arising from conical back reflection. The polarization ellipse is plotted at 11 × 11 grid positions, with red corresponding to right- and blue to left-hand circular polarisation. (a) The input polarization profiles. (b) The predicted polarization profile after metallic reflection from a perfectly conducting hollow cone and (c) after TIR from an ideal glass cone with a Fresnel-induced phase shift of π/4 at each interface.

