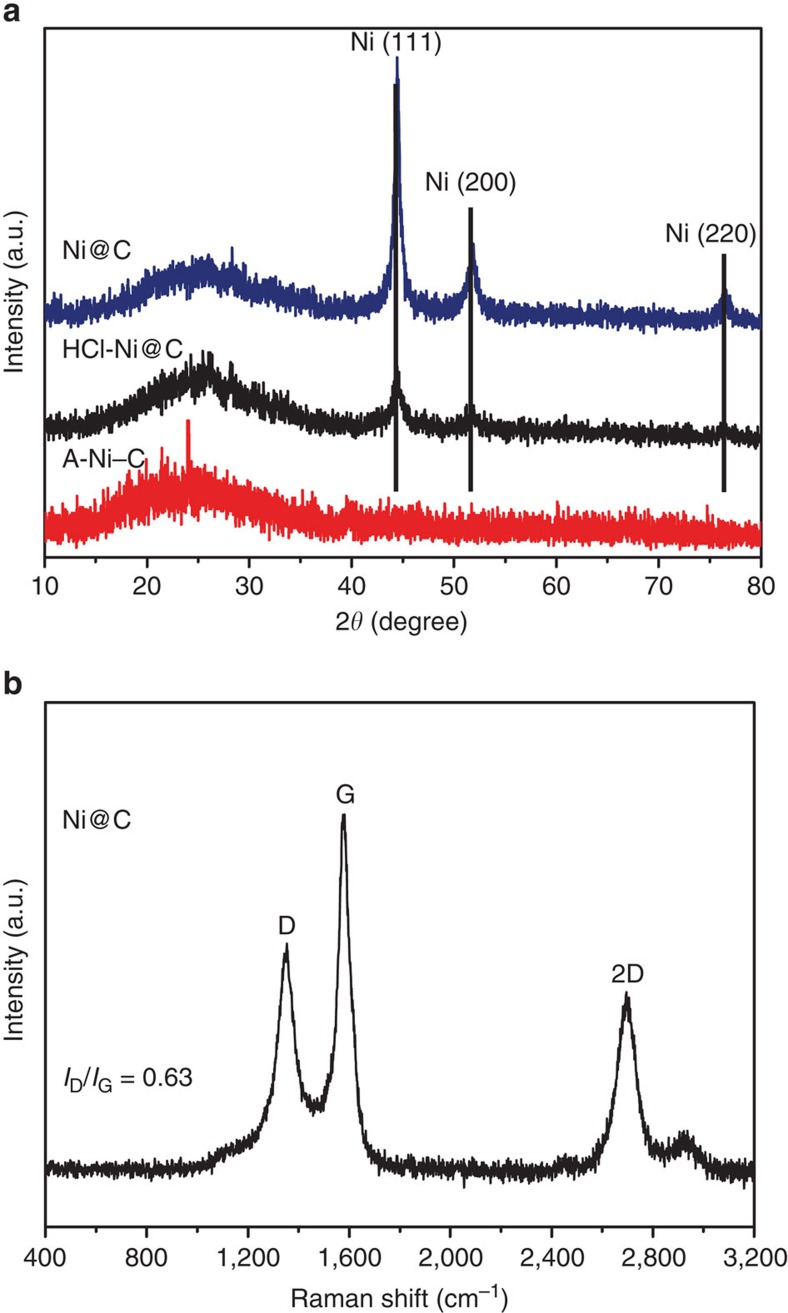
Figure 3. Structure characterization of the Ni–C catalysts.
(a) XRD patterns of Ni@C, HCl-Ni@C and A-Ni–C, respectively. The diffraction peaks of Ni in Ni@C and HCl-Ni@C confirm the existence of well crystalline Ni metal. The red line corresponding to A-Ni–C illustrates that no Ni–Containing crystal phase was detected after activation process. (b) Raman spectrum of Ni@C with ID/IG=0.63, indicating the partial graphitization at 700 °C.

