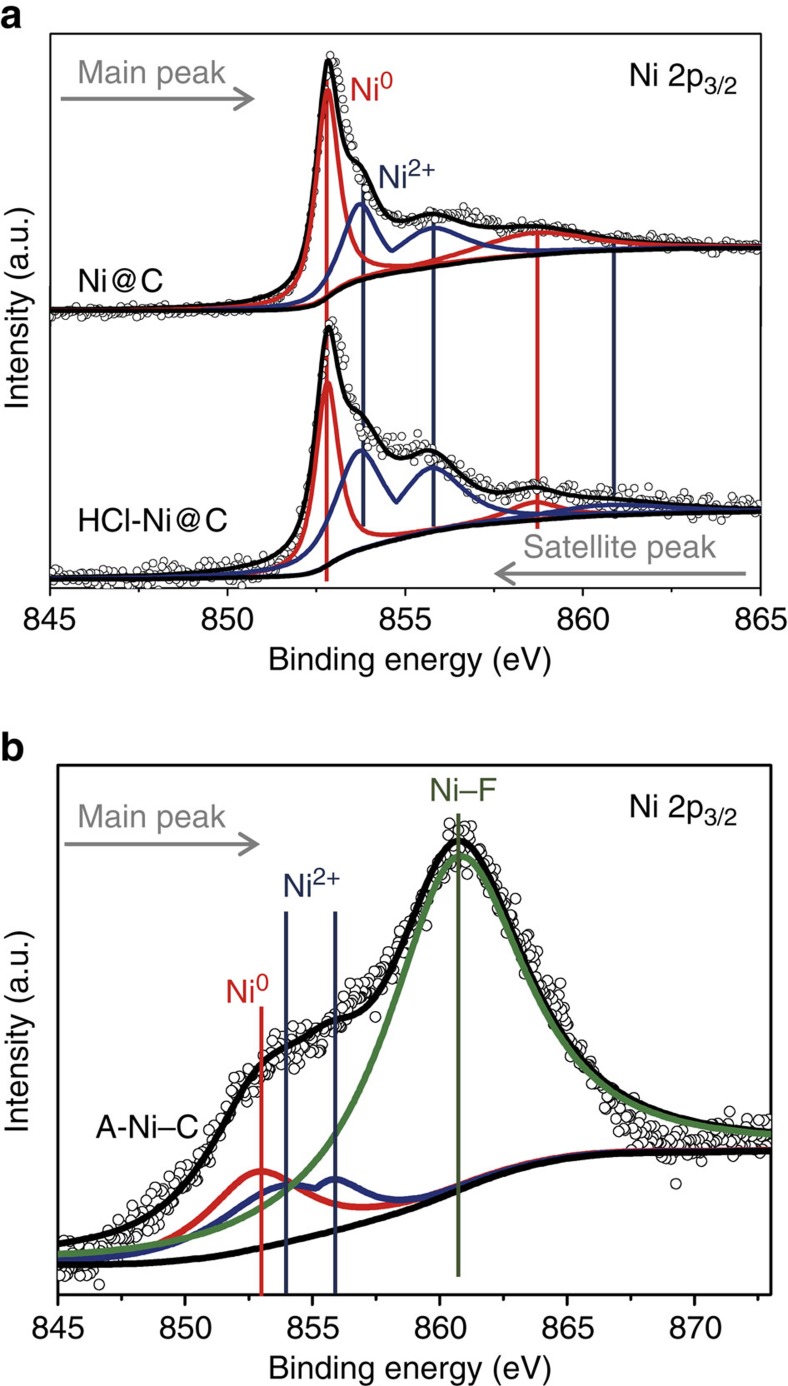
Figure 4. XPS spectra of the Ni–C catalysts.
(a) XPS spectra of Ni 2p peaks of Ni@C and HCl-Ni@C. (b) XPS spectrum of Ni 2p peaks of A-Ni–C. The peaks at 852.8 eV and 853.7 eV are assigned to Ni0 and Ni2+, respectively. The sharp peak at 860.7 eV can be correlated with Ni–F binding, and the element F comes from Nafion solution.

