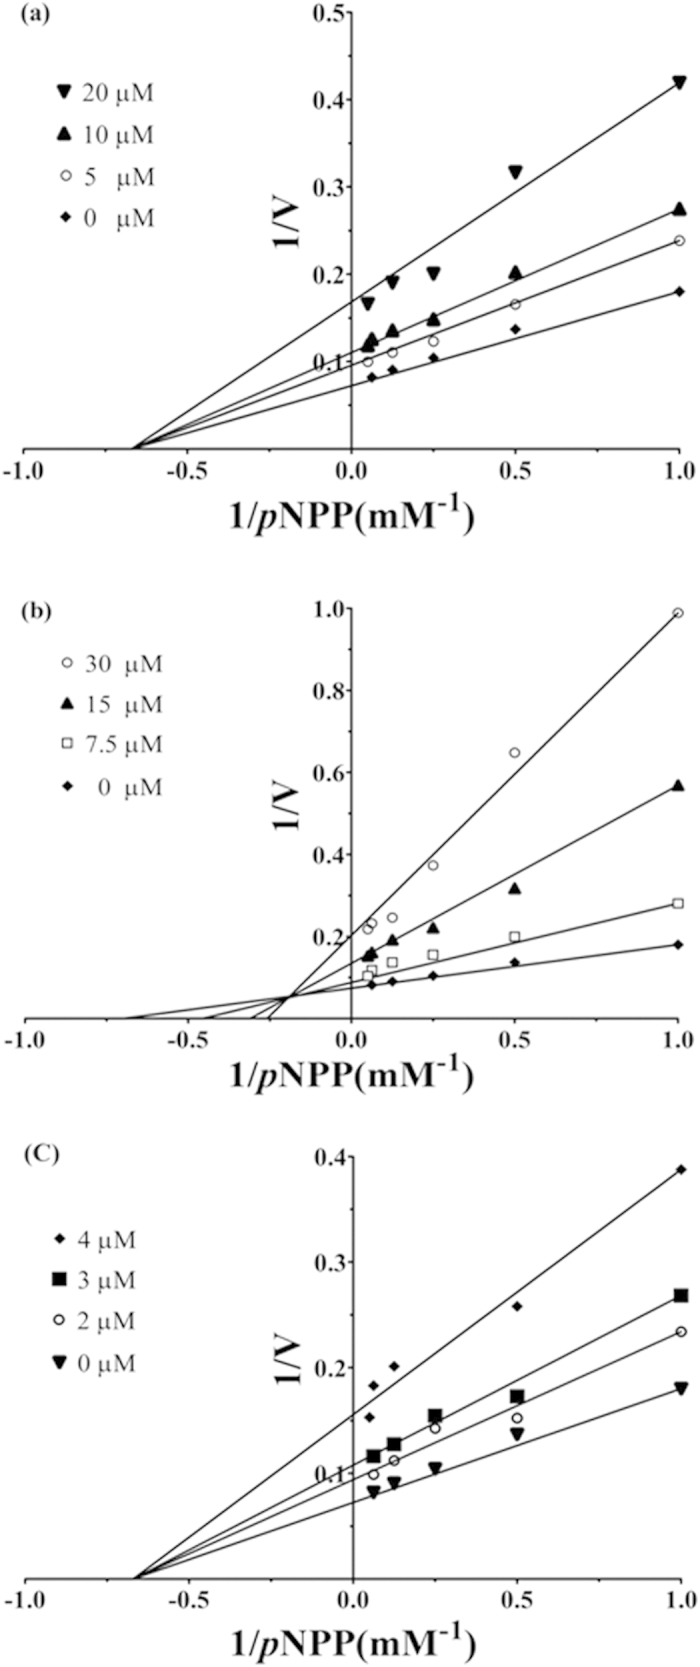
Figure 9. PTP1B kinetics assay of lupeol, betulin, and betulinic acid indicated by Lineweaver-Burk plot.

(a) The concentrations of lupeol are 0 μM, 5 μM, 10 μM, and 20 μM, respectively. (b) The concentrations of betulin are 0 μM, 7.5 μM, 15 μM, and 30 μM, respectively. (c) The concentrations of betulinic acid are 0 μM, 2 μM, 3 μM, and 4 μM, respectively.
