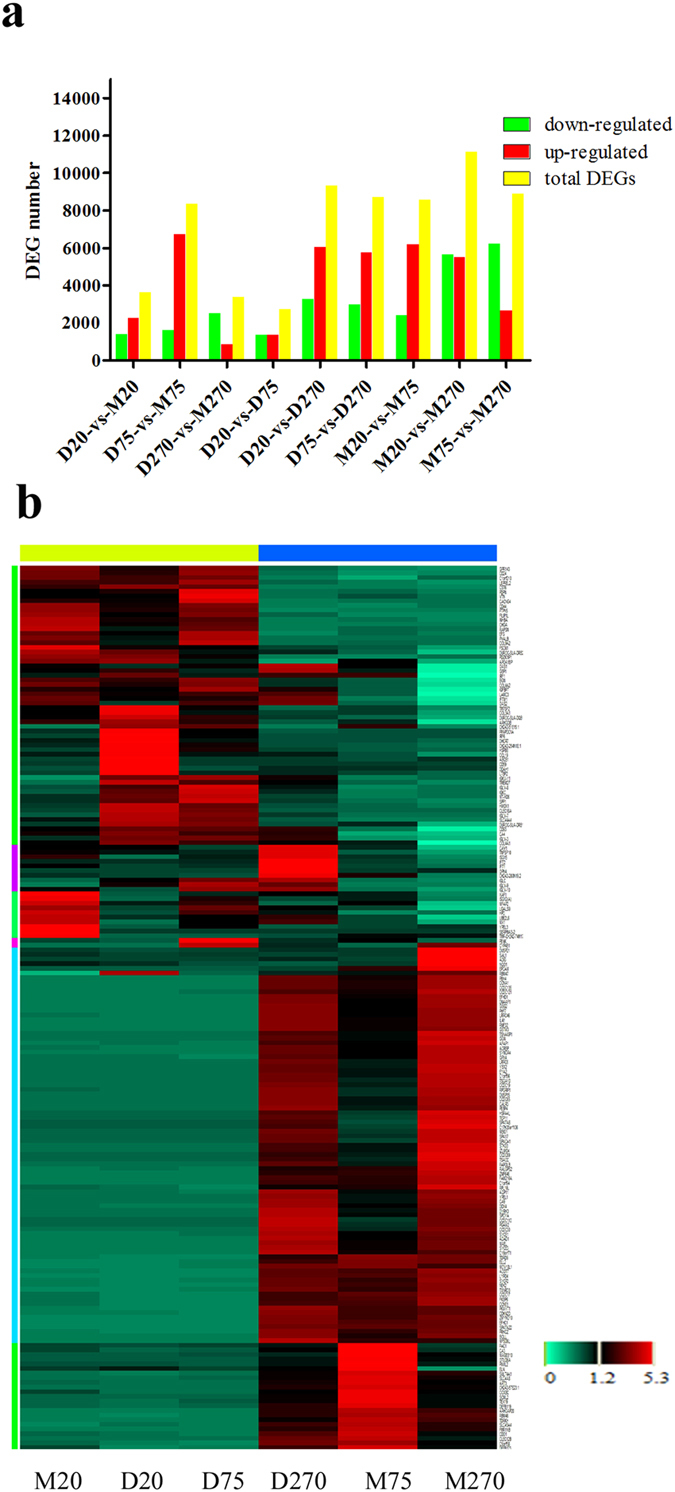
Figure 3. Analysis of differentially expressed genes.

(a) DEGs (FDR ≤ 0.001 and |log2 Ratio| ≥1) detected in each sample. (b) The heatmap of the subset DEGs (FDR ≤ 0.001, |log2Ratio|≥3, RPKM > 1) in different samples. Six color parts in the left represent six expression patterns.
