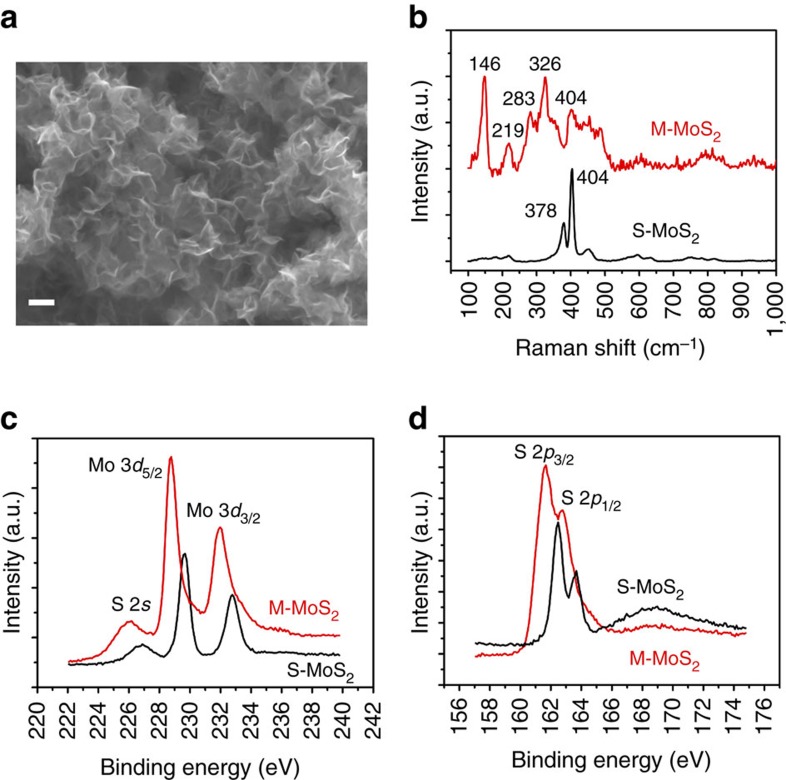
Figure 1. Morphology of M-MoS2 and phase identification of M-MoS2 and S-MoS2.
(a) SEM image of M-MoS2 showing the nanosheet structures. Scale bar, 100 nm. (b) Raman shift of M-MoS2 and S-MoS2. (c,d) High-resolution X-ray photoelectron spectroscopy (XPS) spectra of Mo 3d (c) and S 2p (d) for M-MoS2 and S-MoS2.

