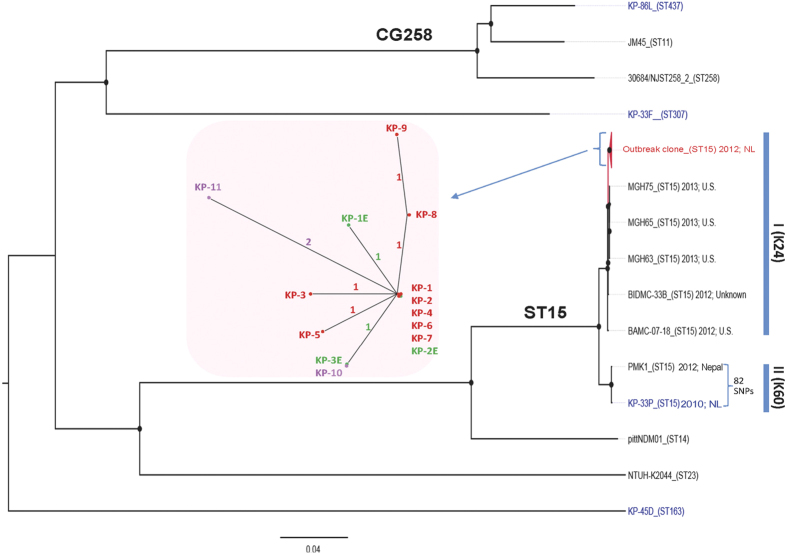
Figure 2. Core-genome phylogenetic analysis of K. pneumoniae isolates.
A maximum likelihood tree was constructed based on the alignments of a 4.47 Mb genome, defined as the core genome in this study. The tree was mid-point rooted. The size of node represents the percentage of bootstrap support, and the biggest one is equal to 100. Sequence types are indicated between brackets. The isolation time and resource of all ST15 strains are shown. The cluster of outbreak isolates is simplified as a red triangle. The non-outbreak isolates sequenced in this study are in blue, and the others retrieved from GenBank are in black. The inset shows the close-up unrooted tree of outbreak isolates, in which the patient isolates are shown in red (2012) and purple (2013), and the environment isolates are in green. The number of SNPs is indicated on the branches.

