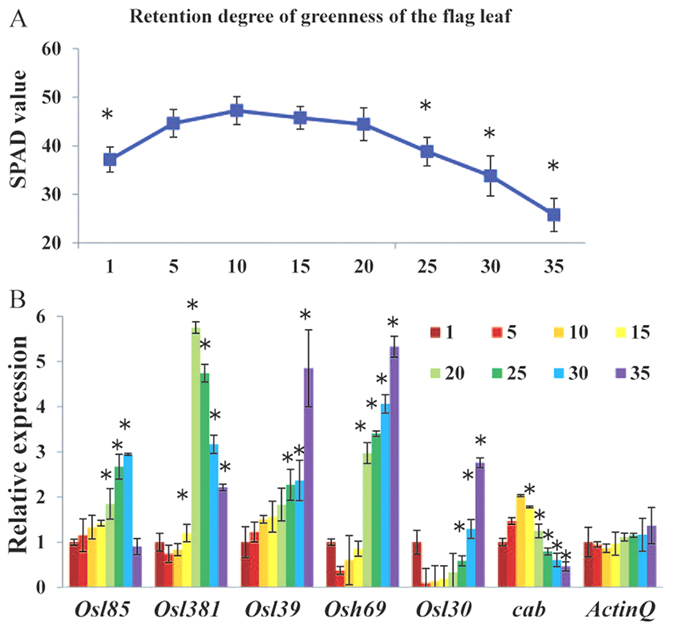
Figure 1. Changes of chlorophyll levels and senescence marker gene expression showing flag leaf development in Minghui 63.

(A) Chlorophyll levels. Each bar shows the mean ± SD of five replicates. (B) Expression profiles of several senescence up-regulated genes and a specific senescence down-regulated gene (cab) reported for rice natural senescence. The numbers refer to leaf samples at 1, 5, 10, 15, 20, 25, 30 and 35 daf (days after forming 1 cm length). Each bar shows the mean ± SD of three replicates. Asterisks indicate significant differences compared to the values at 10 daf (t-test; P < 0.05).
