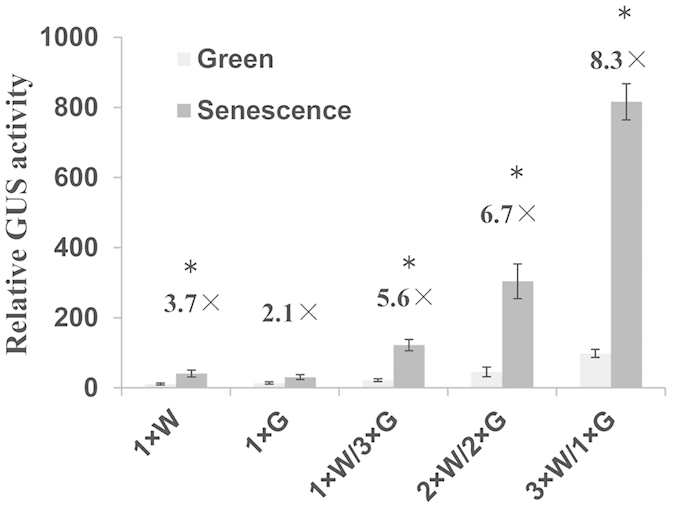
Figure 3. Senescence inducibility of synthetic promoters containing various numbers of W-box and G-box cis-elements.

Light gray bars show the level of GUS activity before senescence (fully expanded green leaf). Dark gray bars represent GUS activity after senescence (senescing leaf with 60%–90% chlorophyll). The fold inducibility is shown, and error bars refer to ±SE of four replicates. Asterisks indicate significant difference before and after senescence (t-test; P < 0.05).
