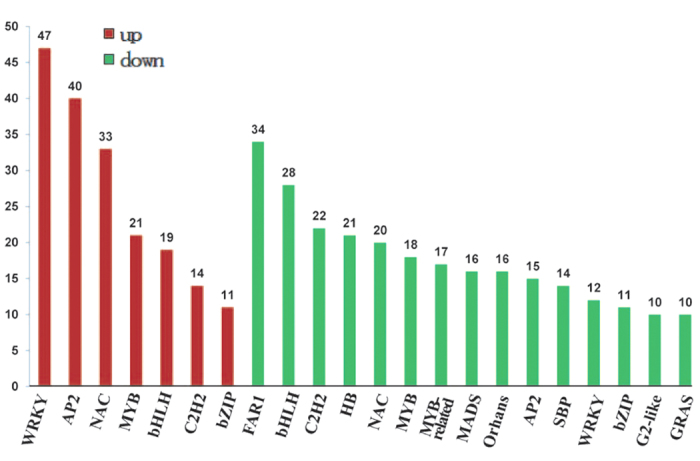
Figure 4. TF families significantly overrepresented among genes differentially expressed during flag leaf senescence.

The number of TFs is shown above each bar. TFs up-regulated (the left 7 columns) were labeled in red and down-regulated (the right 15 columns) in green.
