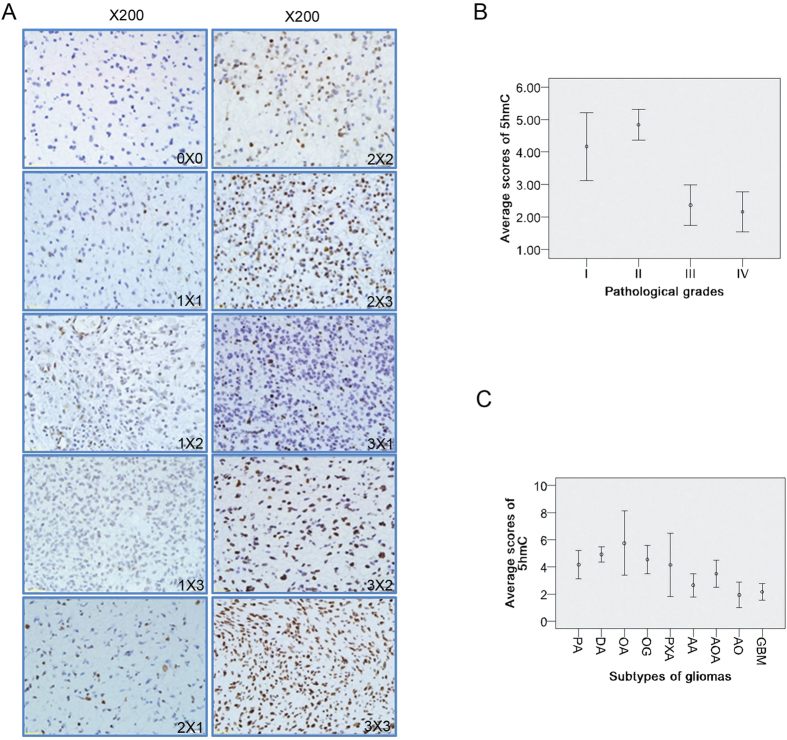
Figure 2. 5hmC level examined by immunohistochemistry, and its relations with pathological grades or subtypes of gliomas.
(A) Representative images of 5hmC immunostaining in glioma tissues. 200×. (B,C) Relations between 5hmC level and pathological grades (B) or subtypes (C) of gliomas. Error bar represents the standard error (SE).

