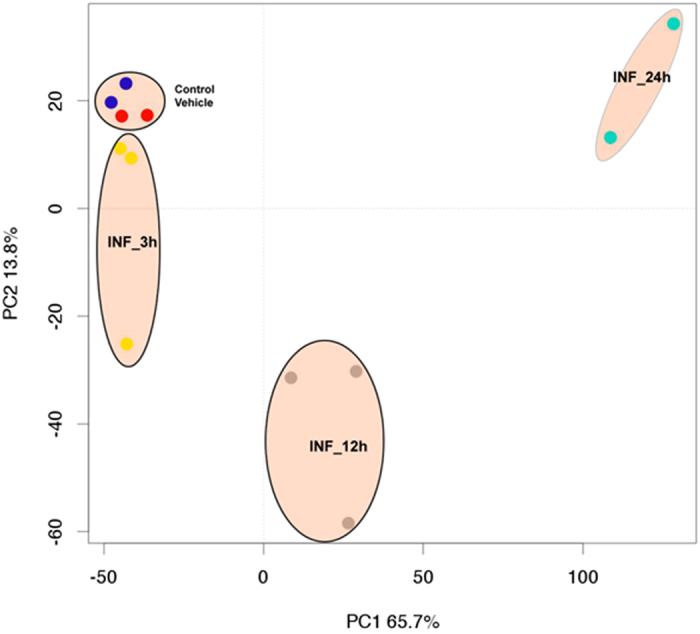
Figure 1. Principal Component Analysis (PCA) of normalized expression data obtained from controls and SA infected samples.

The first component with the highest variance (65.7%) is on the X-axis separating 12 and 24 h post-infection samples from control samples and 3h post- infection samples. The second component, with the second highest variance (13.8%), is on the Y-axis, depicting a maximum variation of the 12 h post-infection samples from rest of samples. The biological replicates from control, 3 h, 12 h, and 24 h samples formed separate clusters on the PCA plot, indicating transcriptional differences among different groups.
