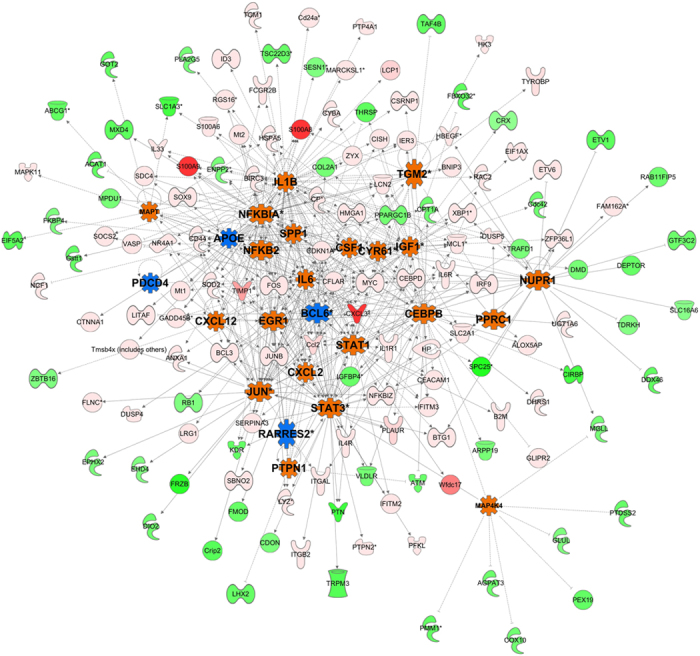
Figure 4. Interactive network of the regulatory molecules and their down-stream targets that are significantly activated or inhibited during the temporal post-infection phase.

Top regulatory genes were selected on the basis of enrichment score, as derived from the dysregulation of target molecules and their fold changes due to infection. In this network, activated and inhibited regulatory molecules are shown with orange and blue color, respectively. The regulatory molecules include the activation of multiple key inflammation related molecules, including NFKB2, IL-1β, CXCL2, and JUN. Also, in this network, each node represents a gene and each edge represents an interaction. The up-regulated and down-regulated target genes are shown with shades of red and green colors, respectively.
