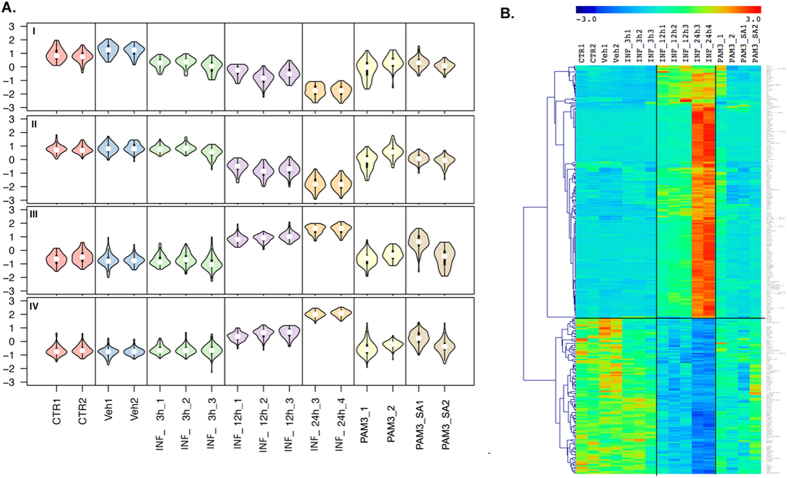
Figure 5. Counter regulation of gene expression by PAM3 pre-treatment, as determined by transcriptome profile comparison of temporal samples with and without PAM treatment prior to infection.
(A) SOM maps representing infection-related gene clusters that were significantly counter regulated by PAM3 pre-treatment. PAM3 pre-treatment counter regulated 280 genes out of the approximately 1,200 genes altered due to infection. (B) Heatmap of genes that are significantly counter regulated due to PAM3 pre-treatment. Columns represent samples, and rows represent genes. Gene expression levels are shown on a rainbow pseudocolor scale (−3 to 3), with red denoting high expression levels and blue denoting low expression levels.

