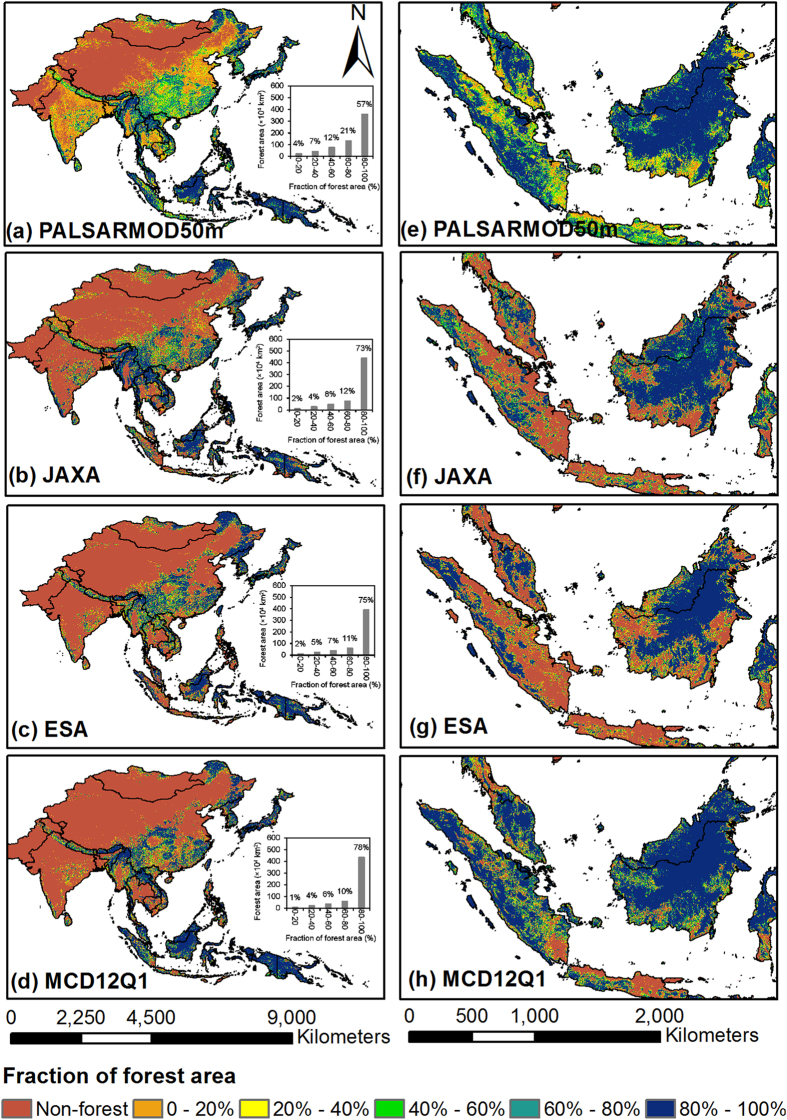
Figure 1. Spatial distribution of forests in monsoon Asia at the spatial resolution of 1,500 m in 2010 from multiple forest/non-forest maps.
(a) PALSARMOD50m forest/non-forest map, produced by the developed algorithm in this study. (b) JAXA forest/non-forest map, provided by the Earth Observation Research Center, JAXA (ftp://ftp.eorc.jaxa.jp/pub/ALOS-2/PALSAR_MSC/50m_MSC). (c) ESA forest/non-forest map, provided by ESA Climate Change Initiative-Land Cover (CCI-LC) project (http://www.esa-landcover-cci.org/?q=node/158). (d) MCD12Q1 forest/non-forest map, derived from MODIS/Terra + Aqua Land Cover Type Yearly L3 Global 500m SIN Grid V051 product, provided by Earth Observing System Data and Information System, National Aeronautics and Space Administration (http://reverb.echo.nasa.gov/reverb). (a–d) were aggregated into 1,500 m for spatial comparison in ArcGIS 10.1. (e–h) Zoomed-in forest/non-forest maps in Southeast Asia from (a–d), respectively. This figure was produced using ArcGIS 10.1.

