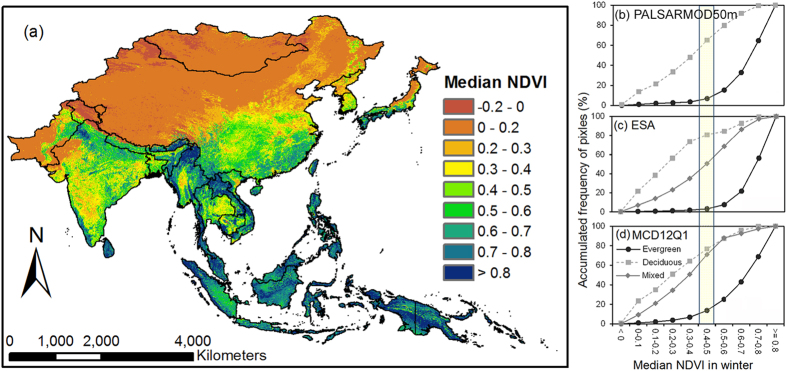
Figure 3. The median NDVI of forests in winter (December, January, and February) in monsoon Asia from 2000 to 2014.
(a) The distribution map of median NDVI in winter from MOD13Q1 product, at the spatial resolution of 250 m, derived from MODIS/Terra Vegetation Indices 16-Day L3 Global 250m SIN Grid V005 product, downloaded from Earth Observing System Data and Information System, National Aeronautics and Space Administration (http://reverb.echo.nasa.gov/reverb). (b–d) are the median NDVI distribution of PALSARMOD50m, ESA, and MODIS forests, respectively. This figure was produced using ArcGIS 10.1.

