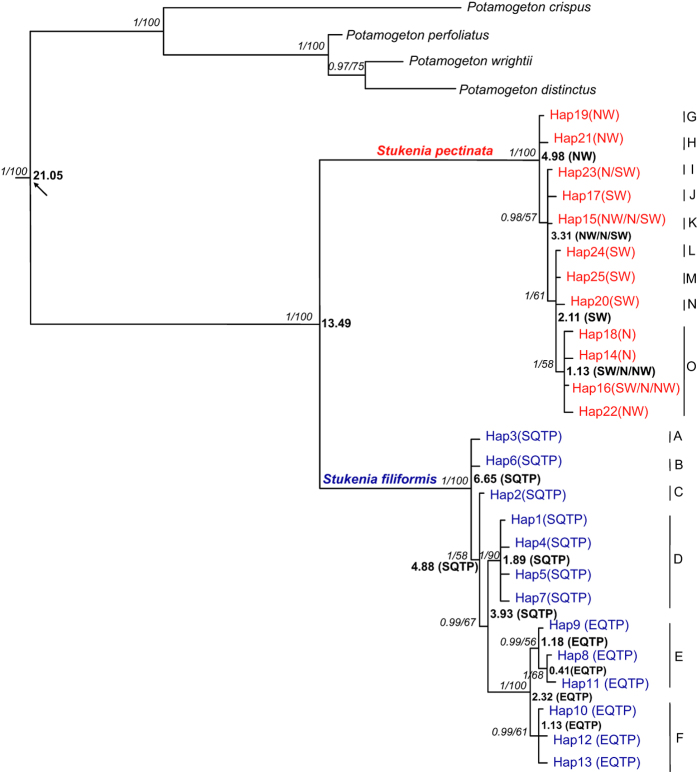
Figure 4. Phylogenetic relationships of haplotypes.
Support values (Bayesian posterior probability /maximum likelihood bootstrap) are next to the nodes. Arrow denotes node where fossil calibration was applied. The divergence times and ancestral areas are shown at nodes. The time scale is in Ma. The distributions were categorized into the following areas: northwest China (NW), north China (N), southwest China (SW), south QTP (SQTP) and east QTP (EQTP).

