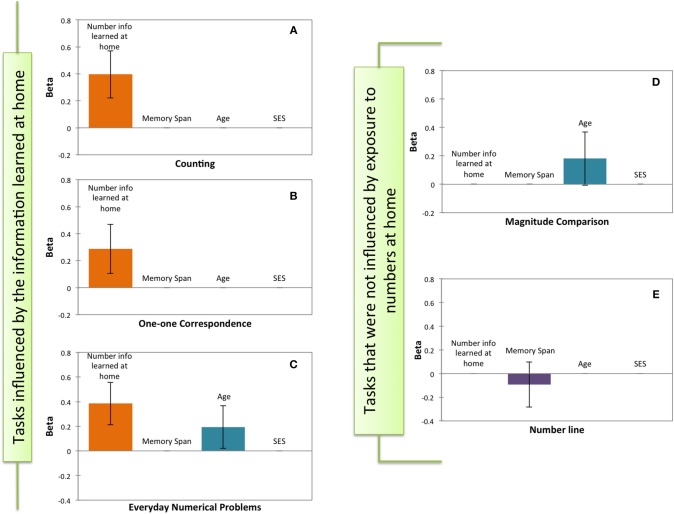
Figure 1.
Significant predictors of the stepwise regressions performed on each mathematical test. (A) Counting. (B) One-to-one Correspondence. (C) Everyday numerical Problems. (D) Magnitude Comparison. (E) Number line test. The y-axis depicts the standardized scores (β) of the predictors in each the model. The x-axis shows the potential predictors: Number Information Learned at Home, Memory Span, Age, and SES. Error bars indicate 95% confidence intervals.

