
. 2015 Sep 25;9(2):38–46. doi: 10.5005/jp-journals-10008-1182
Copyright © 2015; Jaypee Brothers Medical Publishers (P) Ltd.
This work is licensed under a Creative Commons Attribution 3.0 Unported License. To view a copy of this license, visit http://creativecommons.org/licenses/by/3.0/
Graph 4.
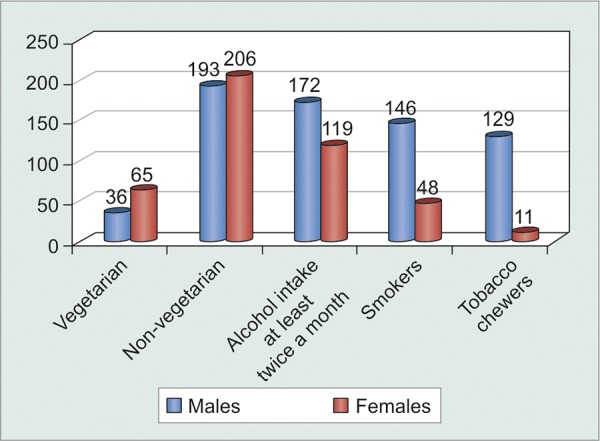
Graphical diet-wise distribution of patients