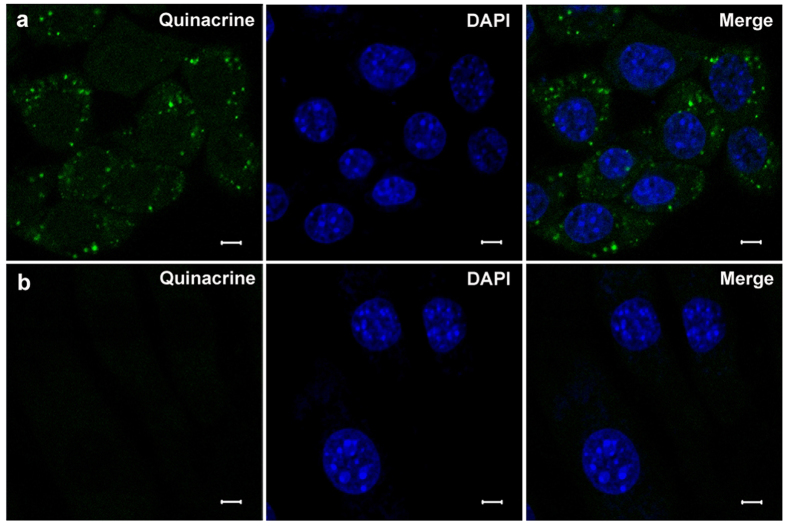
Figure 3. Positive staining of marginal cells and negative control 3T3 cells.
Row (a) Left: numerous granule-like fluorescent puncta in cultured marginal cell cytoplasm incubated with quinacrine; Middle: nuclear staining with DAPI; Right: merged image of quinacrine and DAPI staining. Row (b) Left: The fluorescent puncta did not appear in 3T3 cells (negative control) in the cytoplasm at the same background fluorescence; Middle: nuclear staining with DAPI; Right: merged image of quinacrine and DAPI staining. Scale bars, 5 μm.

