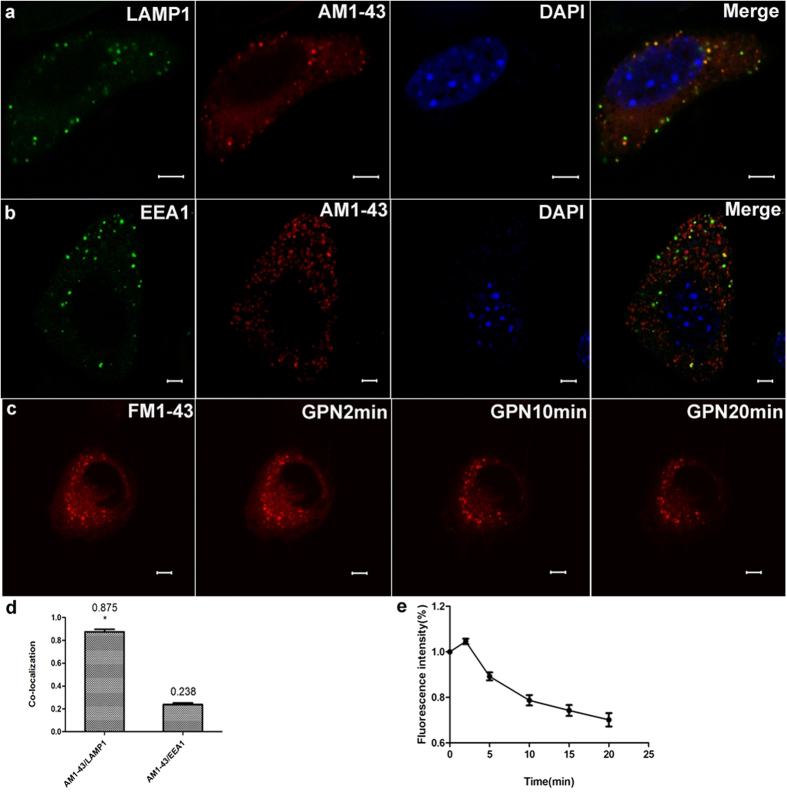
Figure 6. Incubation of marginal cells with FM dyes selectively labels lysosomes and GPN-evoked lysosomal exocytosis in marginal cells.
Row (a) Left 1: green granules immunostained with LAMP1 appeared in a marginal cell; Left 2: red granules labeled by AM1-43 were observed in the same cell; Right 1: the cell nucleus stained with DAPI; Right 2: merged image of LAMP1, AM1-43 and DAPI cell staining indicated co-localization of LAMP1 and AM1-43 puncta. Row (b) Left 1: green granules immunostained with EEA1 appeared in a marginal cell; Left 2: red granules labeled by AM1-43 were observed in the same cell; Right 1: the cell nucleus stained with DAPI; Right 2: merged image of LAMP1, AM1-43 and DAPI cell staining indicated no co-localization of EEA1 and AM1-43 puncta. Scale bars, 5 μm. Row (c) Left1: red fluorescent punctas in the cytoplasm in a cultured marginal cell incubated with FM1-43; Left 2: increased staining was monitored in 2 minutes after GPN stimulation; Right 1: decreased staining was monitored after treatment with 200 μM GPN for 10 min. Right 2: decreased staining was monitored after treatment with 200 μM GPN for 20 min. Scale bars, 5 μm. (d) Summary of the co-localization of AM1-43 with different specific markers. The number above each column refers to mean co-localization coefficient. 5 images obtained from 5 independent experiments were calculated for co-localization analysis in each group, error bars indicate SD. (*P < 0.01 compared with AM1-43/EEA1, independent samples t-test). The merge images of AM1-43/LAMP1 showed a high proportion of co-localization. (e) Summary of fluorescence intensity of marginal cells incubated with FM1-43 after GPN stimulation. n = 5, error bars indicate SD.

