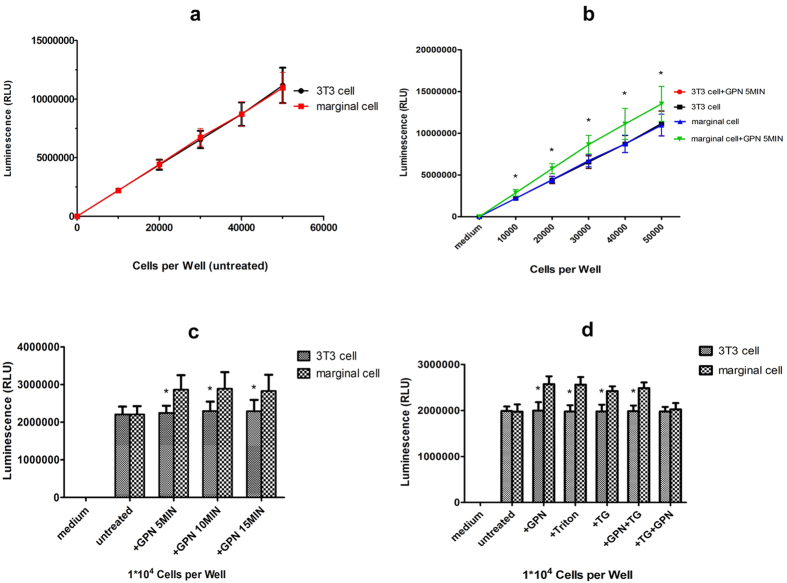
Figure 8. ATP release from marginal cells after treatment with GPN, Triton, TG, GPN + TG.
(a) A direct relationship between luminescence kit and the number of 3T3 cells (r1) or marginal cells (r2) from 0 to 50,000. r12 = 0.9996, r22 = 0.9997 (b) Treatment with 200 μM GPN resulted in an increase of average 27.7% of luminescence in serial fivefold dilutions of marginal cells compared with 3T3 control (n = 12, *P < 0.01, independent samples t-test). Error bars indicate SD. (c) Time course of ATP release in marginal cells and 3T3 cells after 200 μM GPN exposure (n = 12, *P < 0.01, independent samples t-test). Error bars indicate SD. (d) Respective treatment with different reagents (200 μM GPN, 1% Triton X-100, 10 μM TG, 200 μM GPN + 5 μM TG) for 5 min resulted in ATP release from marginal cells compared with 3T3 control (n = 12, *P < 0.01, independent samples t-test). However, GPN (200 μM) did not cause ATP release from marginal cells compared with 3T3 control after TG treatment (5 μM) for 5 min (n = 12, P > 0.05, independent samples t-test). Error bars indicate SD.

