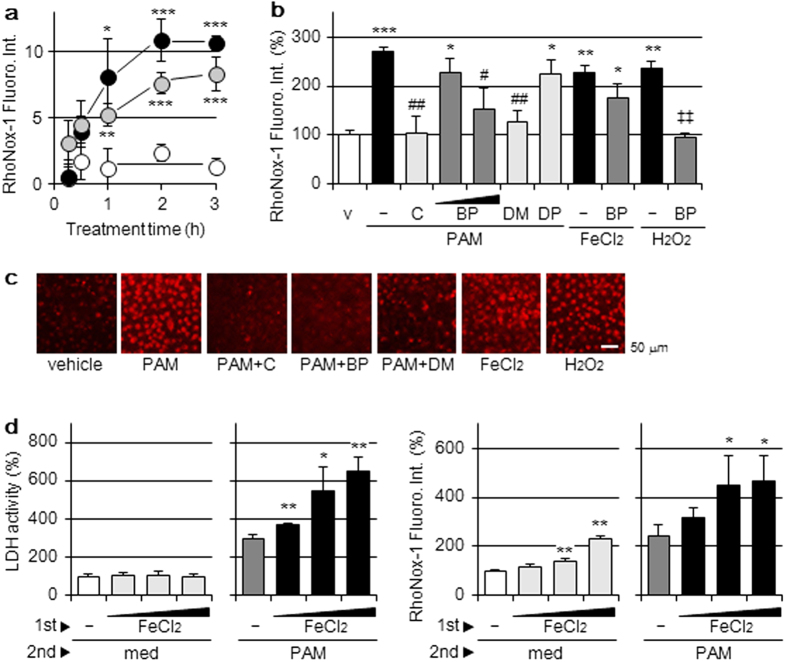
Figure 2. Elevations in Fe(II)-specific fluorescence by the PAM treatment.
(a) A549 cells were treated with DMEM (open circle), PAM (closed circle), or 100 μM FeCl2-supplemented DMEM (gray circle) for the indicated hours in a CO2 incubator, followed by the assay of intracellular Fe(II) levels with RhoNox-1. Data are shown as means ± SD (n = 4). *p < 0.05, **p < 0.01, ***p < 0.001 vs. DMEM. (b) A549 cells were treated with DMEM (v); PAM in the presence or absence of catalase (50 U/mL), BP (50, 200 μM), DMTU (10 mM), or DPQ (20 μM); FeCl2-supplemented DMEM (100 μM) in the presence or absence of BP (200 μM), or H2O2-supplemented DMEM (1 mM) in the presence or absence of BP (200 μM) for 2 h in a CO2 incubator, followed by the assay of intracellular Fe(II) levels. Data are shown as means ± SD (n = 3). *p < 0.05, **p < 0.01, ***p < 0.001 vs. DMEM only (v), #p < 0.05, ##p < 0.01 vs. PAM only, ‡‡p < 0.01 vs. H2O2-supplemented DMEM only. (c) A549 cells were treated for 2 h with the reagents described above in a CO2 incubator, followed by confocal laser fluorescence microscopic observations with RhoNox-1. Scale bars, 50 μm. (d) A549 cells were treated with DMEM containing 10%FCS and FeCl2 (50, 100, 200 μM) for 16 h (1st step) and then with DMEM (med) or PAM for 6 h in a CO2 incubator (2nd step). Assays for LDH activity released into the conditioned medium (left panel) and intracellular Fe(II) levels (right panel) were then conducted. Data are shown as means ± SD (n = 4). *p < 0.05, **p < 0.01, vs. without FeCl2.

