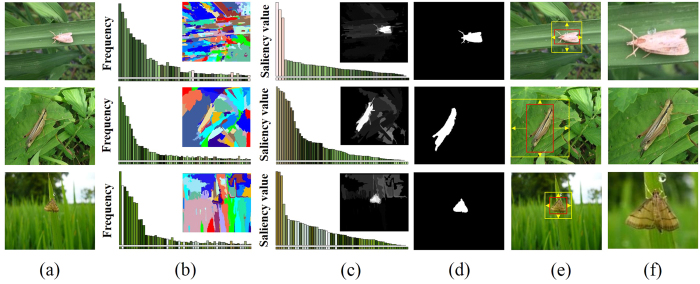
Figure 1. Examples of constructing Pest ID.
(a) original images, in which the first and the third rows are provided by Guoguo Yang, and the second row courtesy of Keiko Kitada. (b) segmented regions and the corresponding color histograms. (c) saliency maps and saliency value of each region. (d) GrabCut45 segmentation results initialized from the thresholded saliency maps. (e) localization results, in which tight bounding boxes (red) containing pest insect objects are extended to squares (yellow). (f) Pest ID images.

