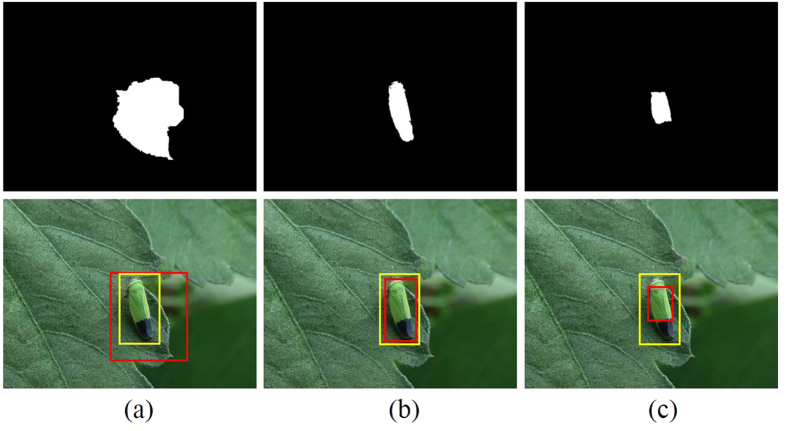
Figure 4. An example for visual comparison of localization results at different threshold th.
(a) th = 0.1. (b) th = 0.3. (c) th = 0.5. Column 1: Thresholded saliency maps. Column 2: The ground truth boxes (yellow) and localization boxes (red) in the original images. Original image for this example courtesy of Masatoshi Ohsawa.

