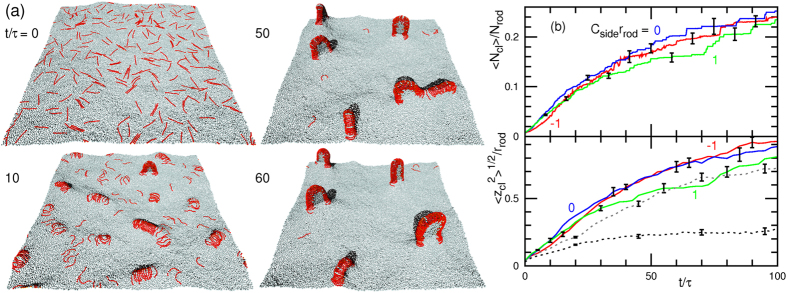
Figure 3. Membrane tubulation from flat membrane for low ϕrod = 0.1 (Nrod = 256), at Crodrrod = 4.
(a) Sequential snapshots at Cside = 0 and γ = 0. (b) Time evolution of  and
and  . The solid lines represent the data for Csiderrod = −1, 0, and 1 at γ = 0. The gray and black dashed lines represent the data for
  and 37.5 at Cside = 0, respectively. Error bars calculated from eight independent runs are displayed at several data points.

