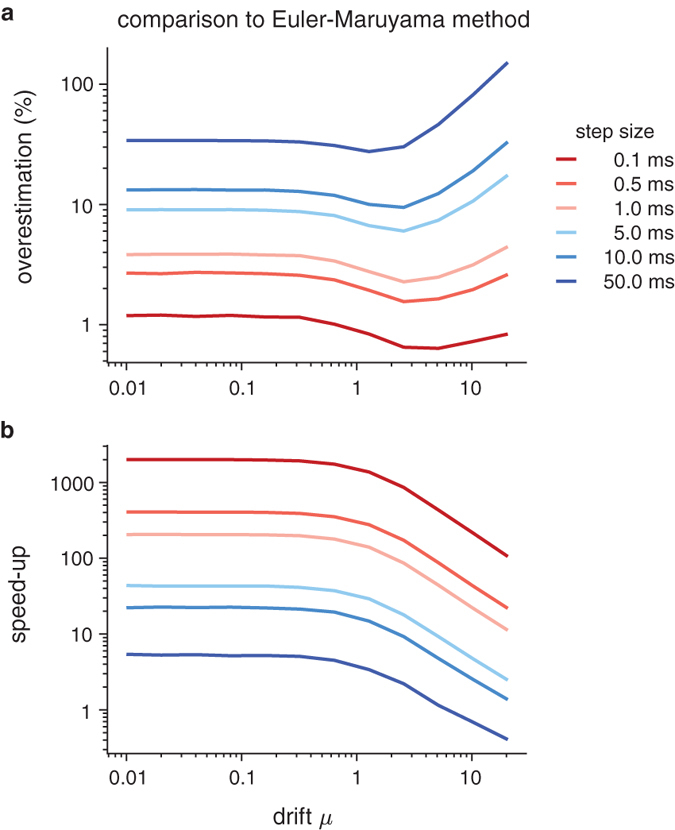
Figure 5. Comparison of our method to the Euler-Maruyama method.

(a) shows the overestimation of first-passage time resulting from the Euler-Maruyama method for different step-sizes Δ and drifts μ. For each Δ and μ we computed the average first-passage time by averaging over 107 Euler-Maruyama simulations of a diffusion model. The degree of over-estimation was found by dividing this average by the analytical expression for this average, given by tanh(μ)/μ if μ > 0 and 1 otherwise21. (b) illustrates the speed-up achieved by our method, when compared to the Euler-Maruyama method, for different step-size Δ for the latter, and different drifts μ. A speed-up of 10 means that, on average, our method yields samples ten times faster than the Euler-Maruyama method.
