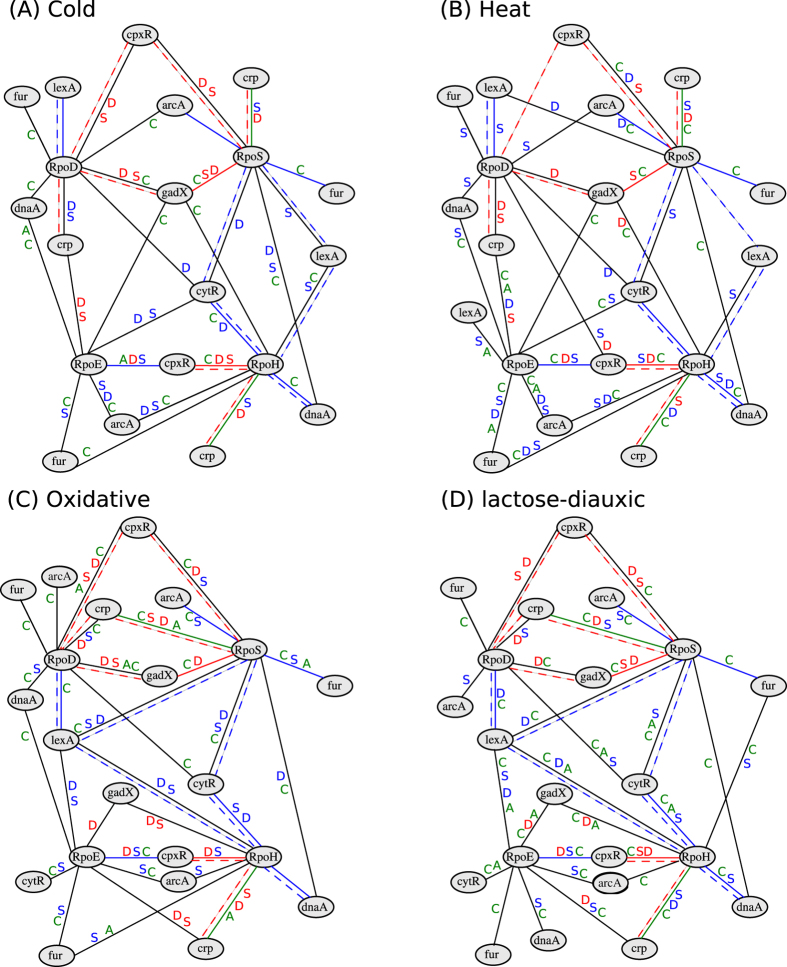
Figure 3. Sub-networks including sigma factors.
The gene regulatory network for four sigma factors, RopD, RopE, RopH, and RopS, together with their experimentally verified interactions obtained from RegulonDB53. The colored edges belong to the sub-network retrieved from RegulonDB, where red edges denote activating, while blue edges indicate repressing regulatory relationships. The edges marked in green are of unspecified regulatory type. If an edge was predicted by a method but is not included in the network from RegulonDB, it is colored in black. The predicted edges for ARANCE, catnet, the network deconvolution and global silencing methods are marked by ‘A’, ‘C’, ‘D’ and ‘S’, respectively, next to the corresponding edges. The letters are color-coded—red, blue or green fonts represent activating, repressing or unspecified relationships, respectively. The dotted edges denote the relationships predicted by the proposed approach. Illustrated are the predicted regulatory relationships and their types based on data from (A) cold, (B) heat, (C) oxidative stress, and (D) lactose-diauxic shift time-series experiments.

