
Figure 2.
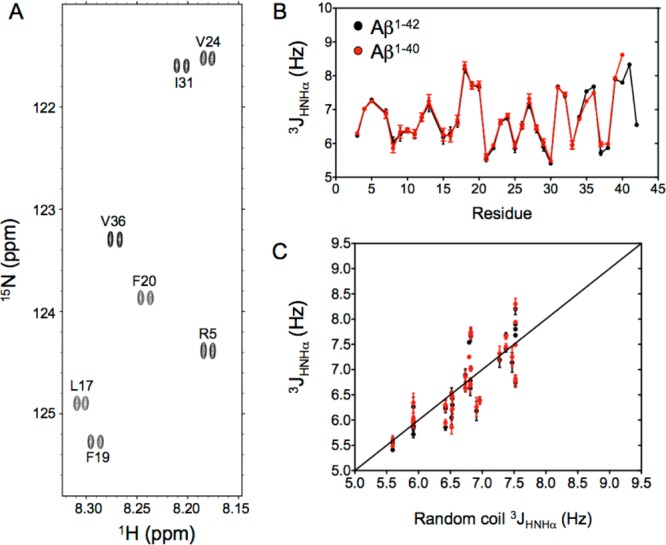
3JHNHα couplings measured in the Aβ peptides. (A) Small expanded region of the 15N–1H TROSY spectrum recorded at a 1H frequency of 800 MHz for the Aβ1–42 peptide showing the well-resolved doublets of cross-peaks arising from the J coupling between the 1HN and 1Hα protons. (B) 3JHNHα coupling values measured for the Aβ1–40 (red) and Aβ1–42 (black) peptides at 277 K. (C) Plot of 3JHNHα measured for Aβ1–40 (red) and Aβ1–42 (black) against residue-specific random coil values, derived from α-synuclein.55