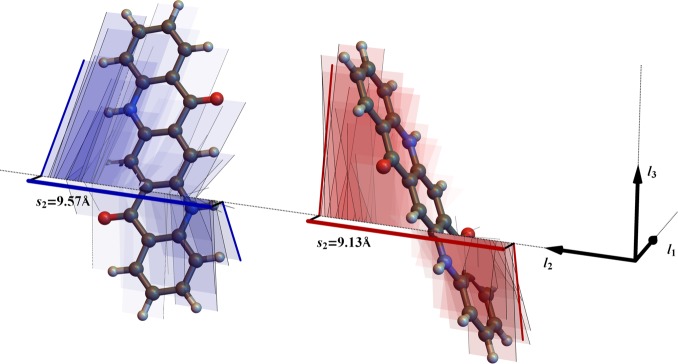
Figure 2.
Molecular projections onto lattice vectors, used to define the sampling range for unit cell lengths. The directions of the three lattice vectors, l1,2,3, are shown, and the molecular projections of two quinacridone molecules are shown onto lattice vector l2. Thin lines show the projection of the edges of the van der Waals radii of each atom onto the lattice vector. Bold red and blue lines show the molecular shadows onto l2. In this example, s2min = 9.13 Å and s2 = 9.57 Å.

