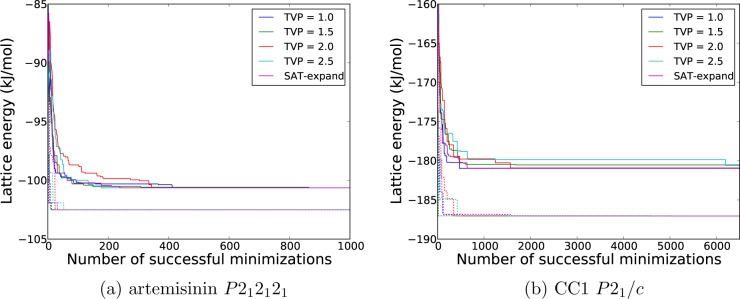
Figure 5.
Average lattice energy of the ten lowest energy structures is shown, as a function of the number of minimized structures generated in the experimentally observed space group for a) artemisinin in P212121 and b) CC1 in P21. The dashed lines indicate the energy of the single lowest energy structure, where the color relates to the same method in the legend. The data had converged after 1000 and 6500 minimizations for a) and b), respectively, so is not shown beyond this point for clarity.

