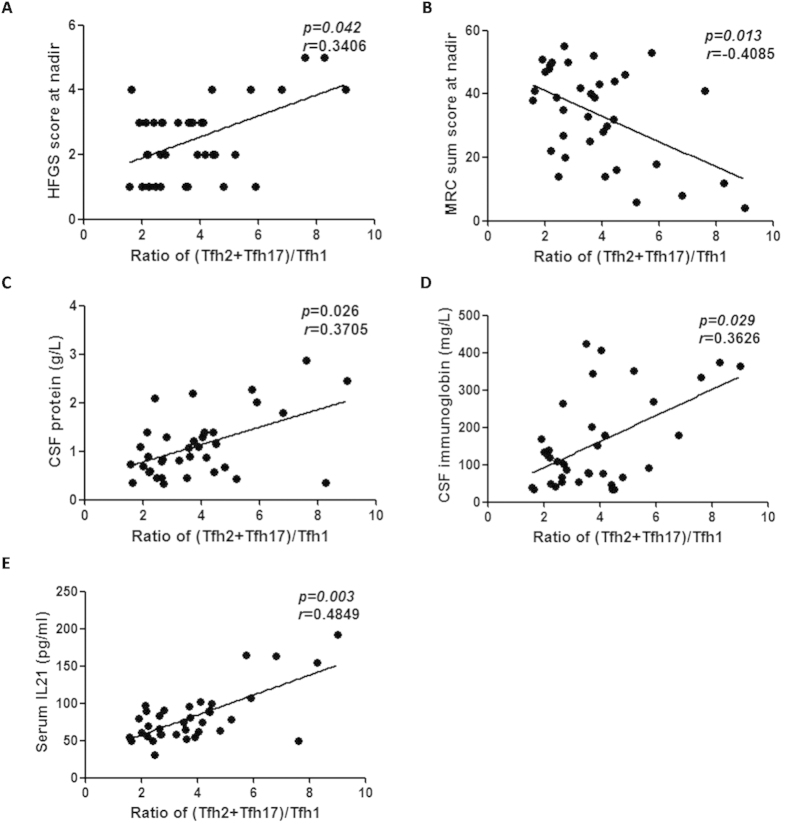
Figure 2. Correlation of clinicopathological features of GBS with the (Tfh2+Tfh17)/ Tfh1 ratio.
(A) Positive correlation of Hughes Functional Grading Scale score (HFGSs) at nadir with (Tfh2+Tfh17)/Tfh1 ratio. (B) Negative correlation of the Medical Research Council sum score (MRC sum score) at nadir with the (Tfh2+Tfh17)/Tfh1 ratio. (C,D) Positive correlation of CSF protein and immunoglobin levels with (Tfh2+Tfh17)/Tfh1 ratio. (E) Positive correlation of serum IL-21 concentration with (Tfh2+Tfh17)/Tfh1 ratio.

