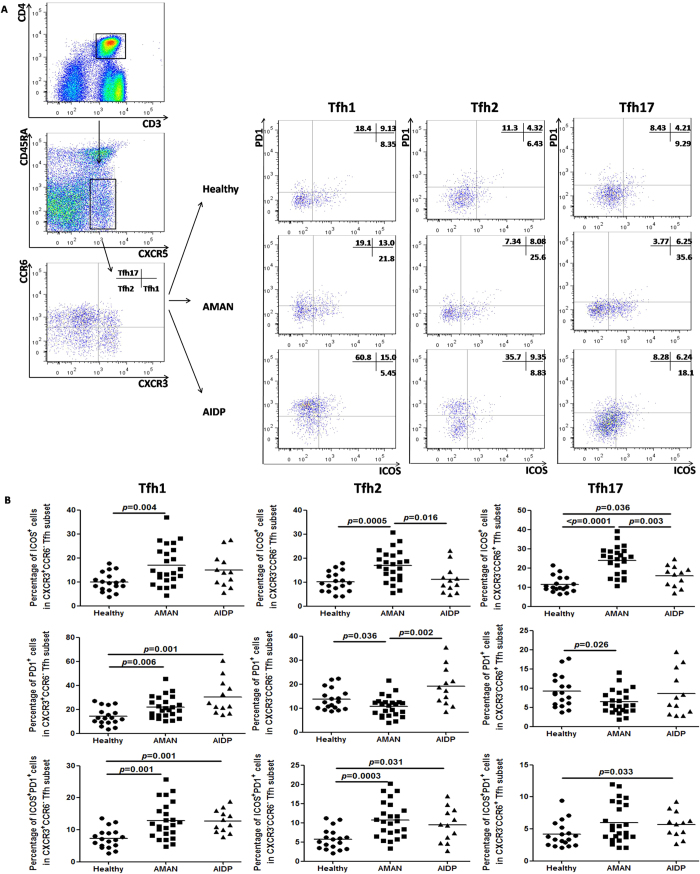
Figure 4. Differential distribution of ICOS+, PD-1+ and ICOS+PD-1+ cells in Tfh cell subsets (Tfh1, Tfh2, and Tfh17).
(A) Tfh cell subsets from GBS patients and HC were stained with anti-CD278 (ICOS), anti-CD279 (PD-1). The percentages of ICOS+ cells, PD-1+ cells and ICOS+ PD-1+cells were assessed by flow cytometry. At least 30,000 events were analyzed for each sample. Data are representatives of different groups of samples from at least two independent experiments. (B) The percentages of ICOS+ cells, PD-1+ cells and ICOS+PD-1+ cells among Tfh1, Tfh2, and Tfh17 cells were respectively analyzed by Mann Whitney test. The horizontal lines show the median values.

