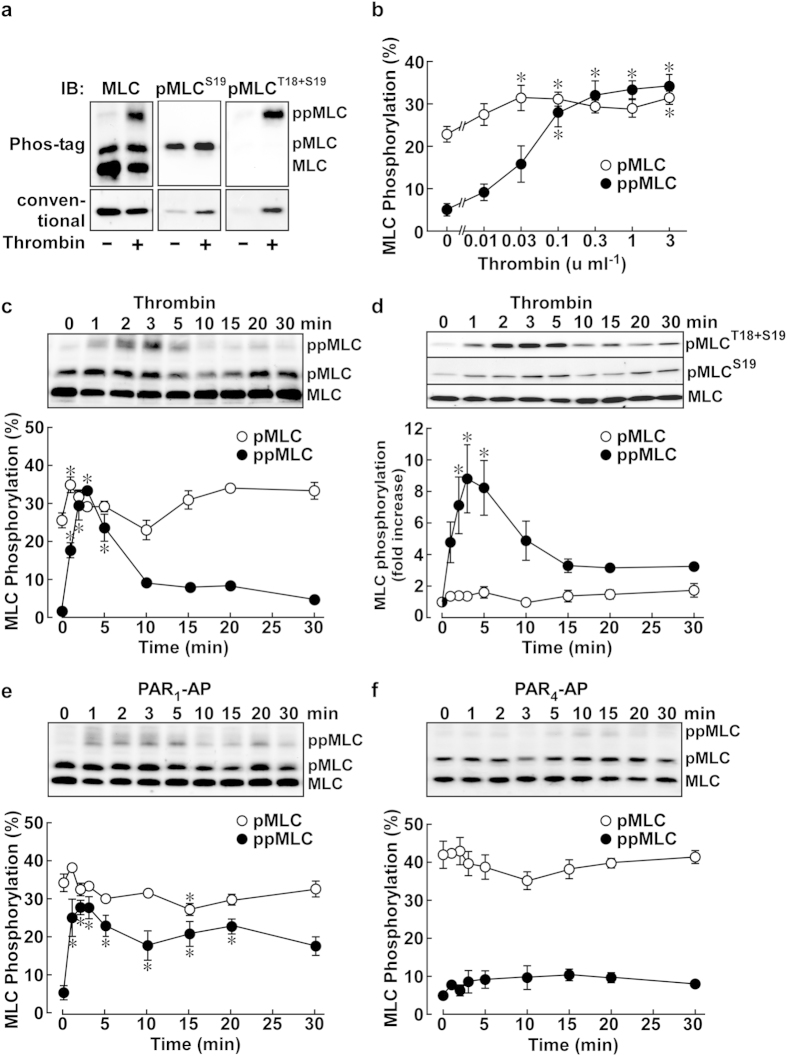
Figure 2. Thrombin-induced phosphorylation of MLC in PAECs.
(a) Representative immunoblots (IB) after Phos-tag and conventional SDS-PAGE. The samples obtained before (−) and 3 min after (+) stimulation with 1 u ml−1 thrombin were applied, in triplicate, to SDS-PAGE. Each set of samples was probed with the indicated primary antibodies. MLC, non-phosphorylated MLC; pMLC, mono-phosphorylated MLC, ppMLC, di-phosphorylated MLC. (b) The concentration-dependent effects of thrombin on pMLC and ppMLC 3 min after stimulation (n = 4–7). (c–f) Representative immunoblots and a summary of the temporal changes in the levels of pMLC and ppMLC induced by 1 u ml−1 thrombin (c; n = 4, d; n = 4–7), 30 μM PAR1-AP (e; n = 4–5) and 30 μM PAR4-AP (f; n = 4), as indicated. The samples were analyzed with Phos-tag (c,e,f) or conventional (d) SDS-PAGE. In (d) the samples were subjected to SDS-PAGE in triplicate, followed by detection with the indicated primary antibody. The data are the means ± SEM. *P < 0.05 vs. the value obtained without thrombin stimulation (b) and at time 0 (c–f), according to an ANOVA followed by Dunnett’s post-hoc test.

