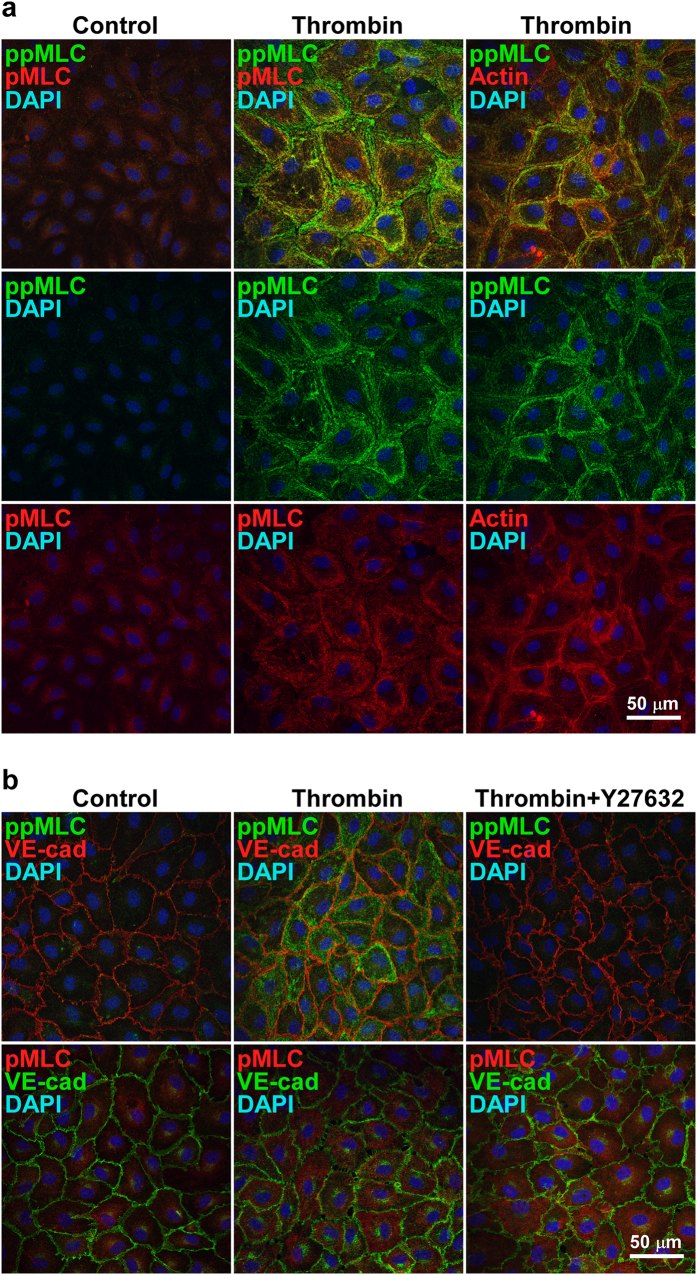
Figure 4. The localization of pMLC, ppMLC and actin in PAECs 3 min after thrombin stimulation with and without a Rho-kinase inhibitor.
(a) Representative confocal microphotographs showing the localization of pMLC, ppMLC and actin before (Control) and 3 min after stimulation with 1 u ml−1 thrombin (Thrombin). Left (Control) and middle (Thrombin) columns; n = 7, right column (Thrombin); n = 2. The top panels show merged images of corresponding middle and bottom panels. (b) Representative confocal microphotographs showing the localization of pMLC and ppMLC in relation to VE-cadherin (VE-cad) before (Control) and 3 min after stimulation with 1 u ml−1 thrombin in the absence (Thrombin) and presence (Thrombin + Y27632) of 10 μM Y27632. Upper row; n = 3, Lower row; n = 2.

