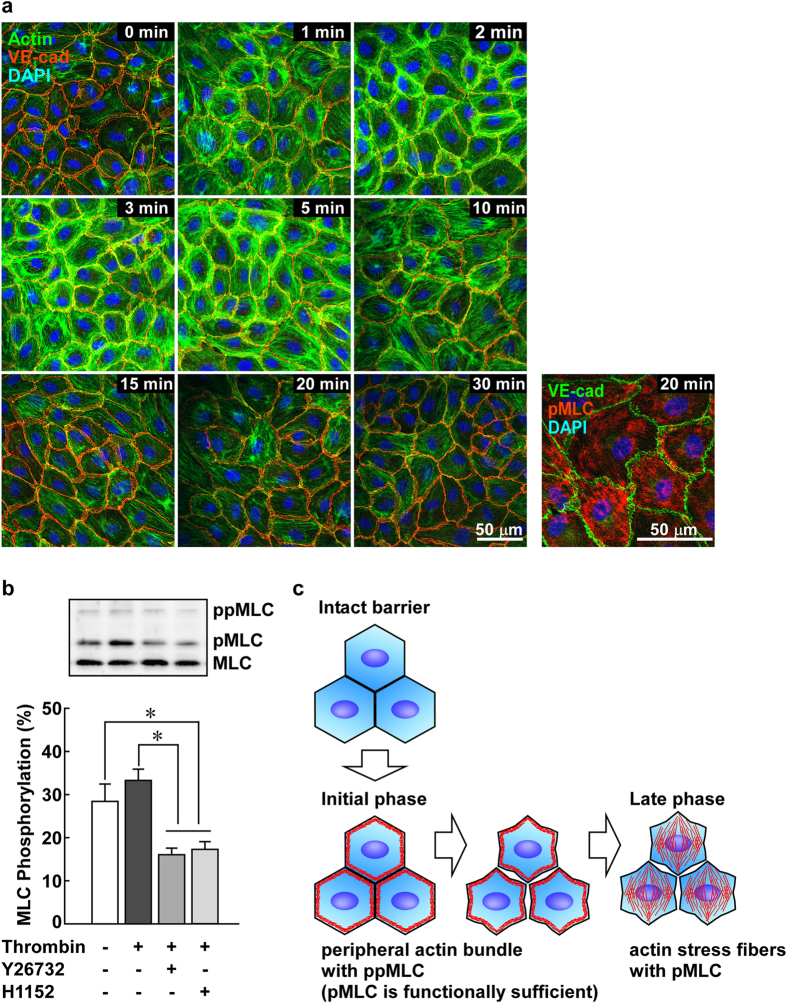
Figure 8. The stress fiber pattern of localization of pMLC and actin in PAECs in the late phase after thrombin stimulation and proposed scheme for the sequential events of barrier disruption.
(a) Representative merged images of confocal microphotographs of the fluorescence staining of VE-cadherin (VE-cad) and actin (n = 4) or VE-cadherin (VE-cad) and pMLC (n = 3) at the indicated times after stimulation with 1 u ml−1 thrombin. (b) The effects of Rho-kinase inhibitors, 10 μM Y27632 and 1 μM H1152, on the level of pMLC at 20 min after thrombin stimulation. The inhibitors were applied 10 min after thrombin stimulation, and the levels of pMLC were evaluated 10 min later, i.e., 20 min after thrombin stimulation, with Phos-tag SDS-PAGE. The data are the means ± SEM (n = 5). *P < 0.05, according to an ANOVA followed by the Turkey-Kramer post-hoc test. (c) A schematic presentation of the proposed sequential events that occur during endothelial barrier disruption.

