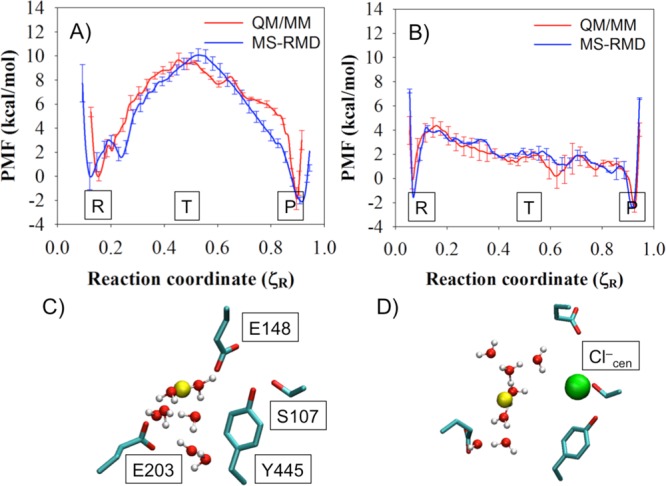
Figure 3.

PMFs of PT through the central region of the ClC-ec1 antiporter with (A) Cl–cen absent and (B) present, as calculated with MS-RMD (blue) and QM/MM (red). Labels “R”, “T”, and “P” indicate the reactant state, the center of the CV range, and the product state, respectively. The CV ζR varies from 0 to 1 as the excess proton CEC moves from E203 to E148. The average side chain positions of four important residues are shown for state “T” in the MS-RMD systems with (C) Cl–cen absent or (D) present. The solvent positions and proton center of the excess charge (CEC, yellow sphere) are taken from the last snapshot.
