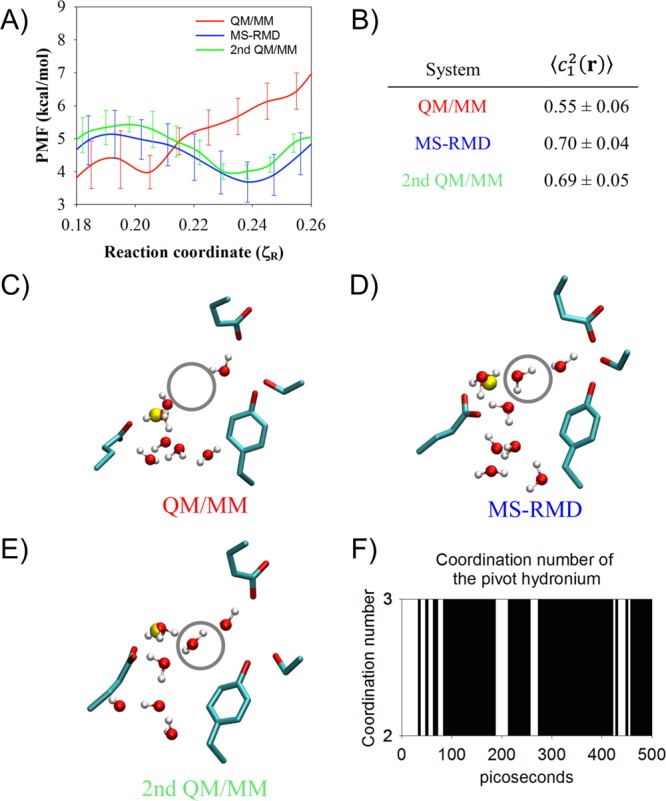
Figure 6.

Panel A: The PMF from Figure 3A for ζR = 0.18–0.26. The second QM/MM PMF (green) was initiated from the final MS-RMD configuration in each window. (B) The average and the standard error of c12(r), reflecting the delocalization of the hydrated excess proton (see text), from the original QM/MM, the MS-RMD, and the second QM/MM umbrella sampling at the window ζR = 0.24. Panels C–E: The averaged structure of the four residues and the water structure in the last snapshot from the (C) the QM/MM, (D) the MS-RMD, and (E) the second QM/MM umbrella sampling at the window ζR = 0.24. The region circled by a gray line represents the position of the second water. (See further description in the main text.) Panel F: The coordination number of the pivot hydronium to oxygen atoms of surrounding water molecules or the carboxyl group of E203 in the MS-RMD simulation, initiated from the configuration at low hydration level, which mimics the configuration of the QM/MM in C.
