
Figure 8.
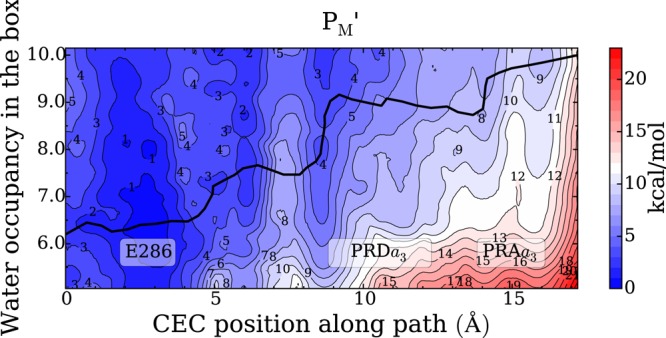
Two-dimensional free energy profiles (2D-PMFs) for PT from the E286 to the PLS in the PM′ state, as a function of the CEC coordinate through the hydrophobic cavity (HC) as the horizontal axis and the water hydration in the HC as the vertical axis. The minimum free energy pathways (black lines) are diagonal in nature, indicating that the two processes are coupled. The statistical errors of the 2D-PMFs are ∼0–3 kcal/mol.