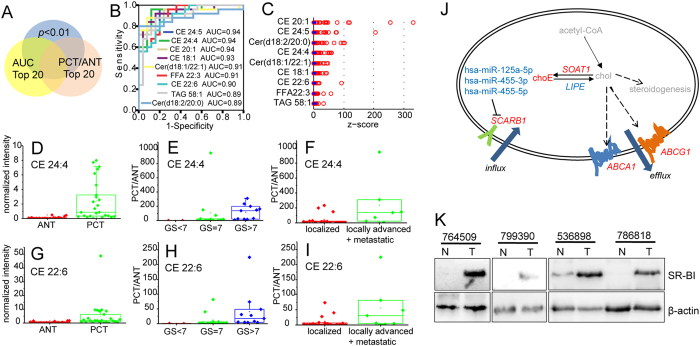
Figure 3. CEs strikingly accumulated in PCa tumor tissues and significantly associated with prostate malignity progression.
(A) Scheme of selecting most prominently elevated lipid species in PCa. (B) ROC curves of selected 9 lipids for differential diagnosis of PCT vs. ANT. (C) Z-score plot of selected 9 lipids. Z-value was calculated as (X- )/SD after uv scaling. Blue dot and red circle represent ANT and PCT respectively. (D,G) Box plot of normalized intensity of CE 24:4 (D) CE 22:6 (G) in paired ANT and PCT. Intensity of CE species was normalized to internal standard (IS) TAG (15:0/15:0/15:0). (E,H) Box plot of PCT-to-ANT ratio of CE 24:4 (E), CE 22:6 (H) in Gleason Score (GS) stages, i.e., GS < 7, GS = 7 and GS > 7. (F,I) Box plot of PCT-to-ANT ratio of CE 24:4 (F), CE 22:6 (I) in metastatic grades, i.e., localized, locally advanced + metastatic. (J) Integrated pathway depicting dysregulated cholesterol homeostasis in PCa. Red, blue and grey colored are significantly increased, significantly decreased and undetected metabolite, or gene, or miRNA, respectively. In italics are gene names. Statistical significance was evaluated by Wilcoxon Signed-Rank test. (K) Immunoblot of endogenous SR-BI in four paired PCT (T) and ANT (N) samples. β-actin was used as a loading control.

