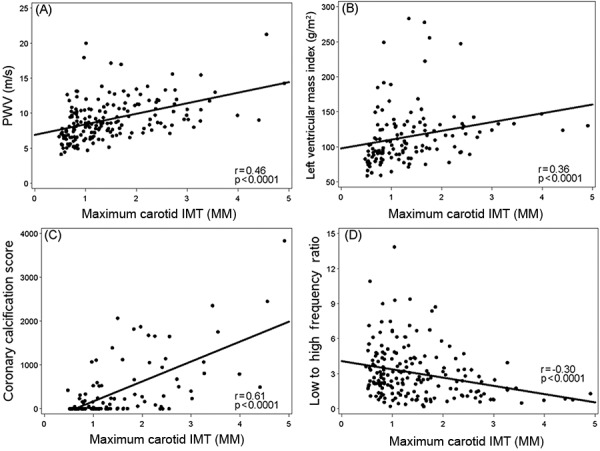
Figure 2. Scatter plot and least squares regression line for maximum carotid intima-media thickness (IMT) versus (A) pulse wave velocity (PWV), (B) left ventricle mass index, (C) coronary calcification score, and (D) heart rate variability (low/high frequency ratio).

