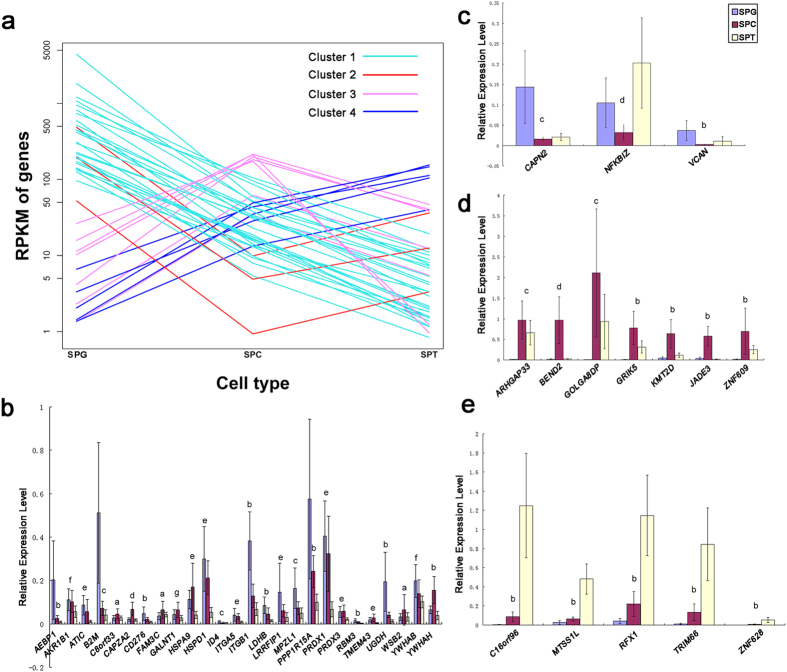
Figure 3. Q-PCR verification of RNA-Seq.
A total of 41 genes from cluster 1–4 were selected to validate the results of RNA-Seq via Q-PCR. (a) The expression curves of the 41 selected genes; (b) Q-PCR results of genes from Cluster 1; (c) Q-PCR results of genes from Cluster 2; (d) Q-PCR results of genes from Cluster 3; (e) Q-PCR results of genes from Cluster 4. The overall expression trends of the 41 genes were consisted with the results of RNA-Seq, suggested that these results were reliable. (T-test was performed. The bars represent standard deviation of the samples, n = 7. Significant difference were determined when p-value < 0.05; Abbreviation: SPG = spermatogonial cell; SPC = spermatocyte; SPT = spermatid; a = no significant difference among the three populations; b = the three populations were significantly different from each other; c = there were significant differences between SPG and SPC, SPG and SPT, while no significant difference between SPC and SPT; d = there were significant differences between SPG and SPC, SPC and SPT, while no significant difference between SPG and SPT; e = there were significant differences between SPG and SPT, SPC and SPT, while no significant difference between SPG and SPC; f = there was significant difference between SPG and SPT, while no significant difference between SPG and SPC, SPC and SPT; g = there was significant difference between SPC and SPT, while no significant difference between SPG and SPC, SPG and SPT).

